
Sulphur 402 Sept-Oct 2022
30 September 2022
US sulphur and sulphuric acid production
UNITED STATES
US sulphur and sulphuric acid production
The US refining sector continues to face operating pressures with 1.3 million bbl/d of closures in the past three years, while sour gas sulphur production has recovered somewhat. Meanwhile, demand from copper and lithium leaching projects will increase use of sulphuric acid over the next few years.
The US continues to be one of the world’s largest producers and consumers of sulphur and sulphuric acid. Domestic production of sulphur and acid are both falling however, while demand may be set to increase due to metal processing.
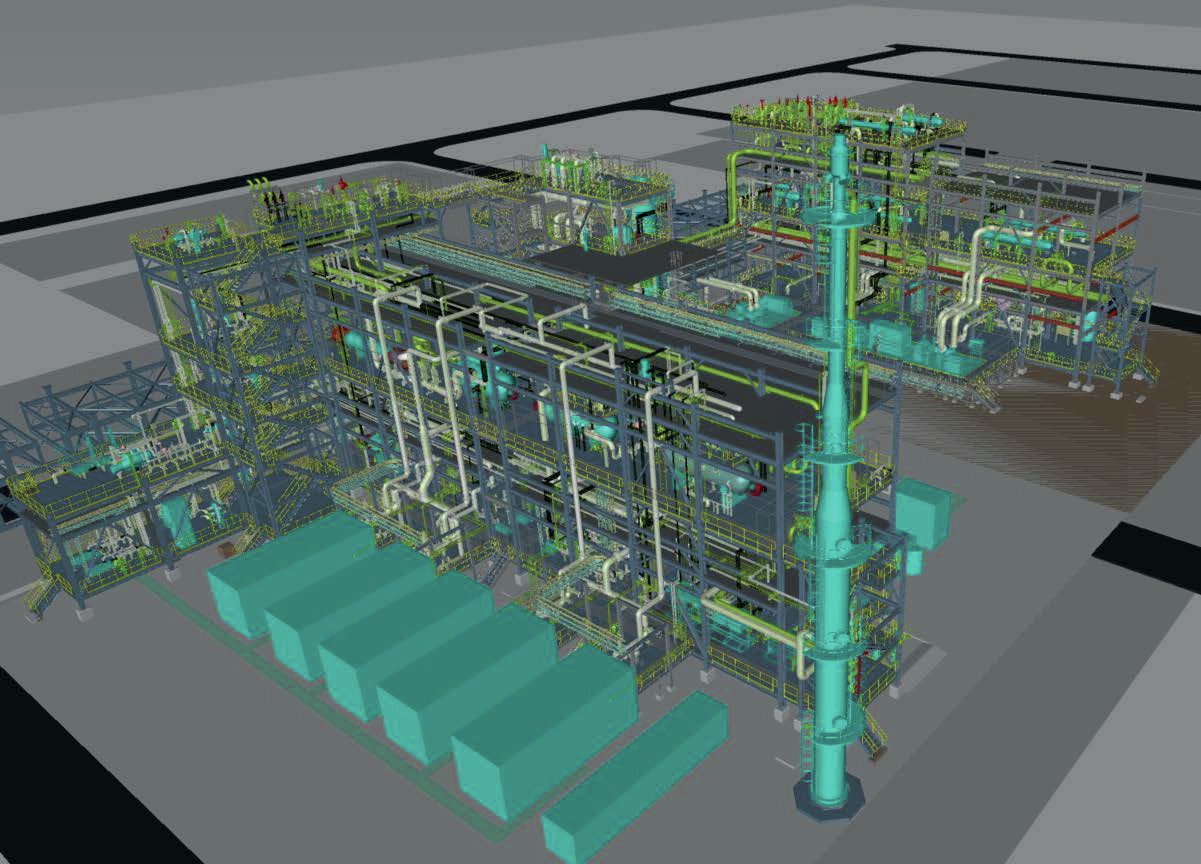
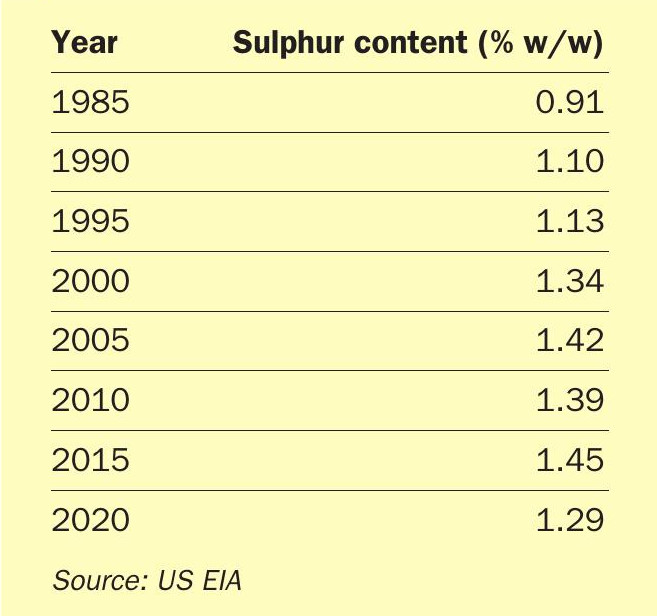
Refining
As Table 1 shows, the refining industry is the main source of elemental sulphur in the US. US domestic oil production has been rising over the past decade, reaching 13.1 million bbl/d in early 2020, before covid related lockdowns and the resultant lack of fuel consumption for vehicles and aircraft led to a slump in consumption during 2020 to a low point of 9.7 million bbl/d in August. Since then there has been a steady recovery, climbing back to around 12.2 million bbl/d at present. Much of the rise has been due to the boom in tight oil production via fracking, which tends to produce fairly sweet fractions. However, US refinery sulphur capacity had risen significantly this century, from 26,600 st/d in 2000 to 34,100 st/d in 2010 and 41,900 st/d (approximately 12.5 million metric t/a) in 2020, according to US Energy Information Administration figures, as many refiners, especially on the Gulf Coast, invested in sulphur recovery capacity both to deal with tightening standards for sulphur content of fuels and to take advantage of the price spread between light sweet crude and sour heavy crude. In 2021 US crude imports came mainly from Mexico (13%) and Canada (10%), both sources of heavy, sour crudes – in Canada’s case mainly as oil sands dilute bitumen, as described in the article elsewhere in this issue. The sulphur content of crude processed by US refineries has been generally on a rise over the past four decades, as shown in Table 2, though recent years have seen something of a slip as more sweet domestic crude is processed.
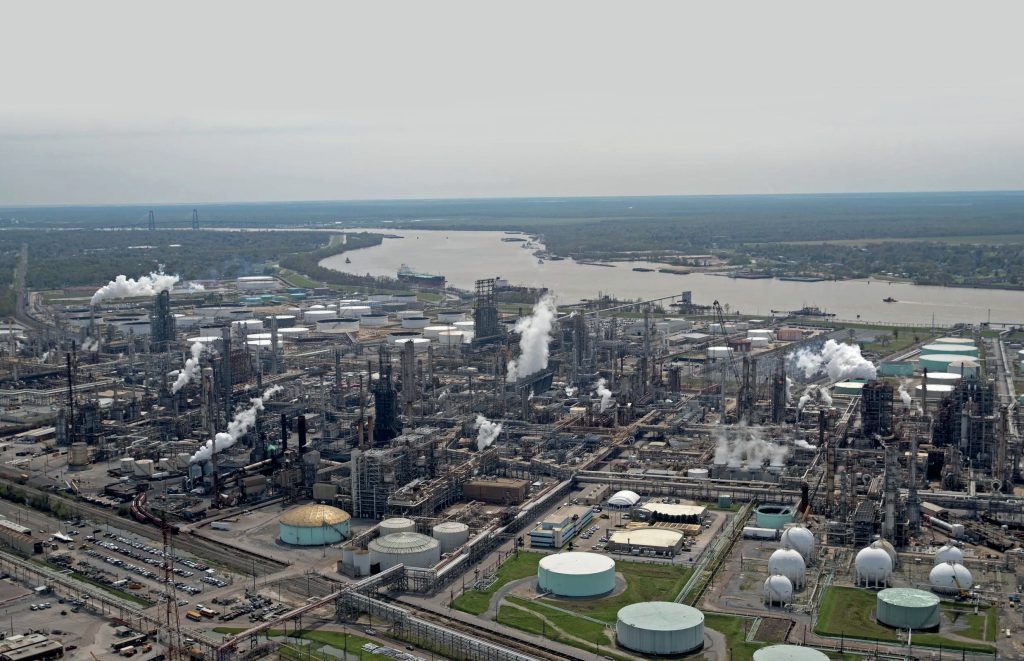
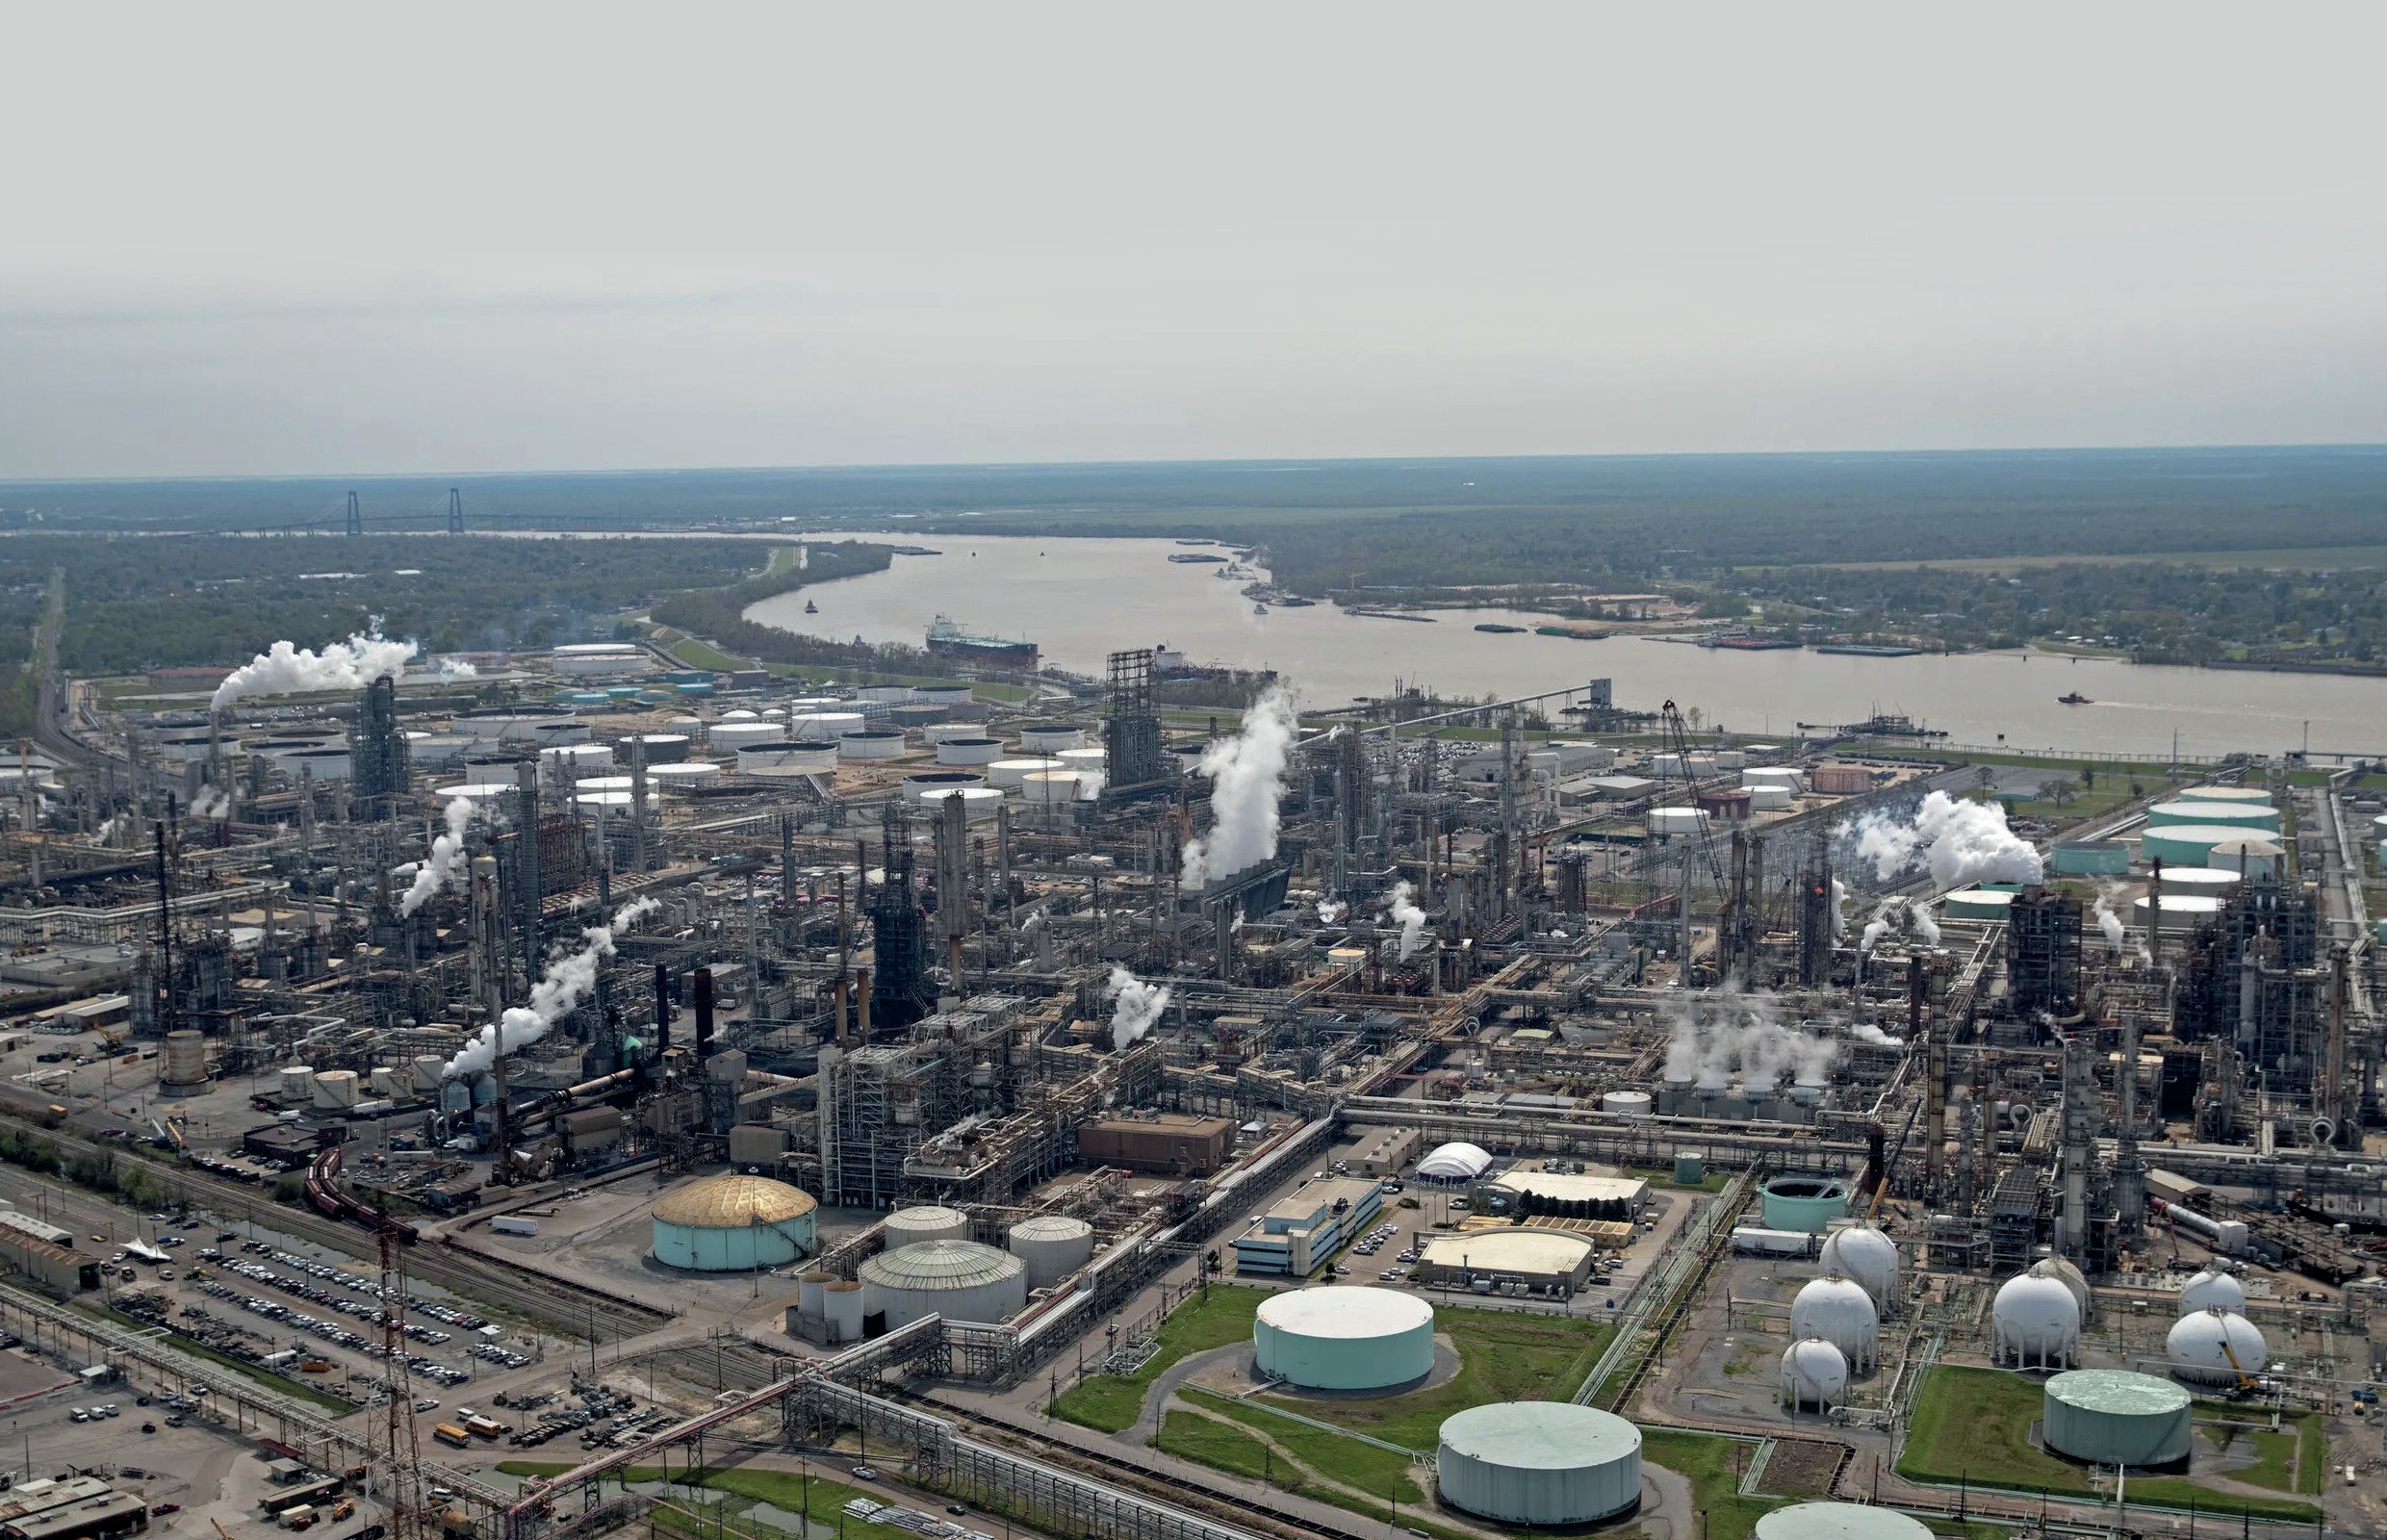
Taken together with imports and other inputs, US refinery throughput fell from 17 million bbl/d in 2019 to 14.7 million bbl/d in 2020, recovering slightly to 15.7 million bbl/d in 2021. The covid-related fall in refinery throughput led to a corresponding drop in US refinery sulphur recovery, from 8.4 million t/a in 2018 to 7.0 million t/a in 2020 and 6.9 million t/a in 2021. US refinery sulphur output is concentrated in the Gulf Coast region (PADD 3), where 60% of sulphur recovery capacity is located. PADD 2 is next, with 20% of capacity, and PADD 5 with 14%. The other two regions each have only about 2.5% each.
One final factor on US sulphur recovery from refineries has been a spate of refinery closures in recent years. Around 1.3 million bbl/d of capacity has closed, including 600,000 bbl/d in Louisiana alone, in spite of some small expansions at existing sites. EIA figures suggest that US crude refining capacity fell to 17.94 million bbl/d at the start of 2022, down from 18.09 million bbl/d at the beginning of 2021, and the record high of 18.98 million bbl/d in 2020 before the pandemic took hold. This is the lowest that capacity has been since 2014. A variety of factors have been blamed for this, from increasing age of plant and rising maintenance requirements, damage caused by recent hurricanes, the impact of the covid collapse in demand, projections of weaker demand in future due to increasing use of alternative fuels, electric vehicles and increased fuel economy of vehicles, or from conversions to produce more renewable fuels, such as the Phillips 66 refinery in San Francisco. Since the Russian invasion of Ukraine, refining margins have actually been running at high levels and operating rates have been high to make up for reduced imports from Russia, but high prices at the pump has also led to some demand destruction. Even so, USGS figures for 1H 2022 show sulphur recovery from refineries up at 3.7 million tonnes, 416,000 tonnes up on the same period for 2021, potentially leading to a full year figure of 8.3 million t/a; the highest since 2018.
Sour gas
The other significant source of elemental sulphur in the US comes from sour gas processing. Though US sour gas processing has been undercut by the fracking boom of the 2000s, production had stabilised at around 600,000 t/a, before dropping to only 300,000 t/a in 2019 and 2020, recovering somewhat to 550,000 t/a in 2021. Most of this (75%) came from the PADD 4 and 5 region – the west coast and northern Rocky Mountains areas. Of the remainder, almost all came from gas processing along the US Gulf Coast.
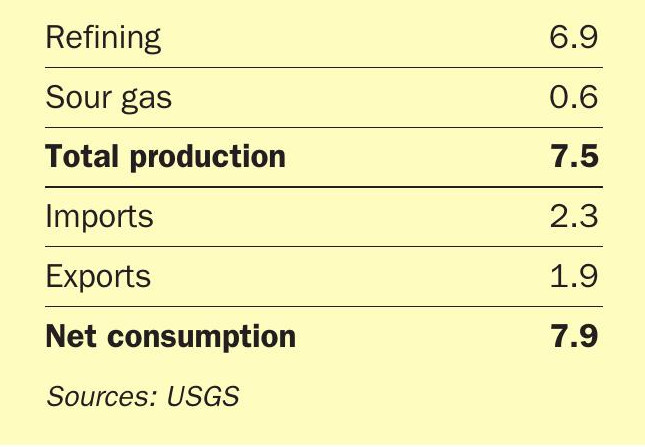
Added to the sulphur from refineries, this gives a total recovered elemental sulphur figure of 7.5 million t/a in 2021 for the US. Half year figures for 2022 are 3.9 million t/a, up 0.4 million t/a on 2021. Net imports add another 400,000 t/a for a total supply figure of 7.9 million t/a for 2021, as shown in Table 1.
Sulphuric acid
In addition to the elemental sulphur, sulphuric acid is also produced from smelting operations within the US.
This is mostly from copper smelting, though there is also some recovery from zinc and molybdenum operations. Acid production is about 1.8 million t/a. In addition to this, the US imported a further 3.3 million t/a of sulphuric acid in 2021, again mostly from Canada and Mexico, and exported 400,000 tonnes, for a net import total of 2.9 million t/a.
“Figures for 1H 2022 show sulphur recovery from refineries up at 3.7 million tonnes.”
Sulphur and acid demand
The US phosphate industry has traditionally been the largest consumer of sulphur in North America, to make sulphuric acid for phosphate extraction. In the US, phosphate rock mining is concentrated in central Florida and Idaho, although there are also mines in North Carolina and Utah. US production of phosphate rock peaked in 1980 at 54.4 million metric t/a, and this had more than halved to 21.8 million t/a in 2021, as mines have become exhausted. Another 2.5 million t/a is imported. Almost all (about 90%) of US demand for phosphate rock is for fertilizer production. The rest goes mainly to animal feed, and some phosphoric acid is used in the food industry. North American production of phosphoric acid in 2020 was 6.3 million tonnes P2 O5 . US downstream phosphate production is mainly aimed at mono- and diammonium phosphate, accounting for 2.7 million t/a P2 O5 and 1.0 million t/a P2 O5 respectively. Growth in production of cheap finished phosphates elsewhere in the world, such as Saudi Arabia and Morocco, are affecting the North American market, combined with depleting resources at phosphate mines. The fall has seen considerable industry rationalisation and consolidation, with only four producers now still active: Mosaic, Nutrien, Simplot and Itafos, and only nine phosphate processing sites now in operation. However, the recent run of high phosphate prices has been a fillip for the US phosphate industry, encouraging higher operating rates.
Outside of the phosphate industry, there is sulphur demand to manufacture sulphuric acid for metal leaching and other industrial processes, including caprolactam, pulp and paper processing, and especially sulphuric acid use as an alkylation agent in refining – a field in which the US refining industry has been a pioneer. There is also around 2 million t/a of demand from copper leaching projects, mainly in the southwest of the US.
Looking forward, there are new copper leaching projects at Florence, Arizona, FCX’s Lone Star project, also in Arizona, and Excelsior’s Gunnison project, which could collectively add about 1.3 million t/a of extra acid demand by 2025. There are also several lithium projects for battery production, mostly in Nevada and Utah, which could add considerable additional demand for acid by 2024-5. Global lithium demand is projected to rise from 500,000 t/a in 2021 to 3-4 million t/a in 2030. CRU is predicting around 2.0 million t/a of additional acid demand for lithium production in the US by 2025.
Together with additional sulphuric acid demand for alkylation in refineries, this is likely to see US acid demand increase by over 3.5 million t/a by that time, as well as potentially some return from phosphate processing. With US sulphur and acid production falling, this is likely to mean additional imports of both sulphur and acid over the coming years.