
Sulphur 405 Mar-Apr 2023
31 March 2023
Controlling SO2 emissions
SULPHUR MARKETS
Controlling SO2 emissions
Most processes involving sulphur, from smelting to refining, produce sulphur dioxide as a by-product. Regulations continue to tighten on industrial SO2 emissions worldwide, leading to greater recovery of sulphur and sulphuric acid at these sites.

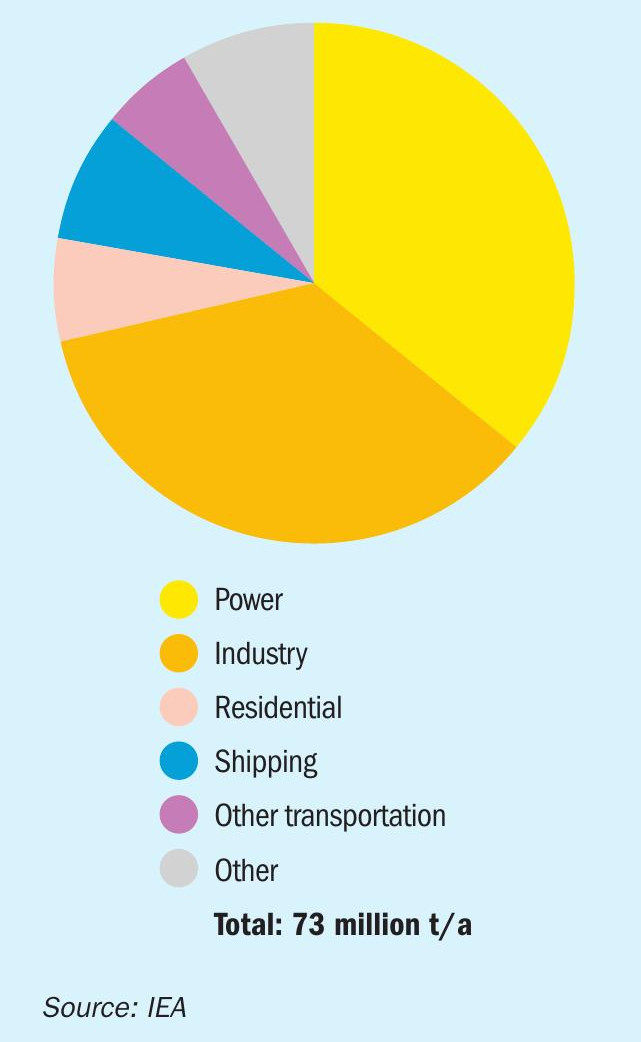
Sulphur dioxide’s deleterious effects on human health and the environment are well known. In the presence of water and oxygen, either in atmospheric water or moist mucous membranes in the human body, SO2 can react to form sulphuric acid, leading to irritation of eyes and lungs in humans or in large scale deposition as ‘acid rain’. While there are natural sources such as volcanoes and large scale forest fires, anthropogenic SO2 mostly comes from three sources; burning of fossil fuels that contain sulphur in vehicles for transportation; burning of fossil fuels that contain sulphur in power plants (mainly coal), and industrial processes, particularly smelting of metal sulphides, cement and lime kilns, and production of fuels and gases in refineries and gas plants. Figure 1 shows the rough proportion of these for 2015.
Power
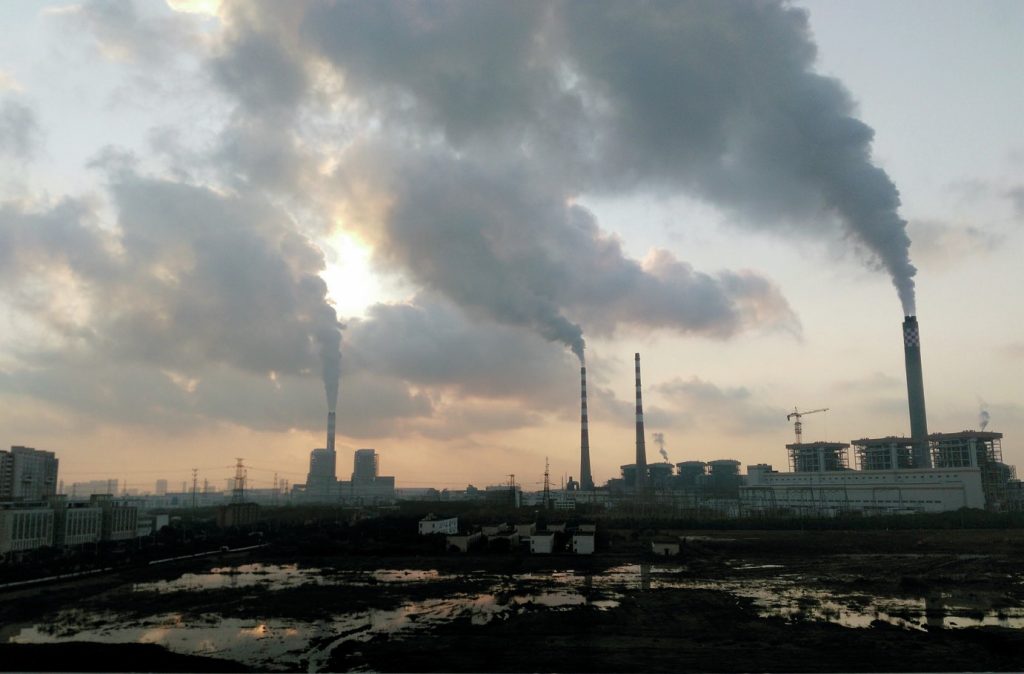
Power was one of the first segments to be tackled, in part by a switch away from burning coal to cleaner fuels like natural gas, and more recently renewables, and in part by the installation of abatement technology at power stations, particularly flue gas desulphurisation (FGD) scrubbers, which spray a mist of suspended calcium carbonate into the exhaust, converting sulphur dioxide to calcium sulphate (gypsum). The impact of this has been a dramatic reduction in SO2 emissions, by about 75% in Europe and North America from 1970 to the present. China, the largest producer of coal-fired power in the world, only mandated FGD technology in 2006, but the impact since then has nevertheless been equally dramatic. Chinese SO2 emissions fell by 62% from 2010-2017 in spite of a major increase in coal fired power use over that period, and the country’s gradual switch from coal to cleaner fuels will lower that further. India is now the outlier, the largest SO2 emitter in the world, and with 52% of those emissions coming from coal-fired power. India’s Ministry of Environment, Forest and Climate Change introduced SO2 emission limits for coal-fired power plants in December 2015, but the deadline for the installation of FGD was delayed to 2022, and more recently to 2024.
The natural gas industry also of course was once a major source of sulphur dioxide from the flaring of acid gas separated from methane, and moves to tackle this were the beginnings of the sulphur industry, in North America and Europe, dating back to the 1950s. While FGD scrubbing produces gypsum, which mainly goes to landfill deposits, hydrogen sulphide recovery from sour gas now produces half of the world’s elemental sulphur, particularly in the Middle East, central Asia and China.
Transport
Removal of sulphur from vehicle fuels has been another major source of sulphur dioxide reductions, and responsible for most of the remaining production of elemental sulphur. Tightening restrictions on sulphur content of fuels began in 1970, but were accelerated in 1992 by the European Union’s adoption of the mandatory fitting of catalytic converters to road vehicles, necessitating the Euro-I fuel standard of a 2,000 ppm (0.2%) limit on sulphur, followed progressively by Euro-II (500 ppm), Euro-III (150/350ppm), Euro-IV (50ppm) and Euro-V (10ppm), the latter implemented in 2009. Most other regulatory regimes around the world have followed the same model, with all of North America, Europe, Russia, China and Australasia now having moved to the Euro-V standard, and most other countries outside of central Africa adhering to Euro-IV. Refineries have moved to supply fuels to the new standards, increasing their sulphur output accordingly. Reducing the sulphur dioxide output of road transport has reduced SO2 emissions from this source by 99% in Euro-V countries and, set alongside the gains from desulphurisation of power noted above, has contributed to total SO2 emissions in, e.g. the United States falling by 95% from 1970-2020.
Two transportation sectors still stood out until fairly recently; shipping and aviation, and particularly shipping was responsible for taking most of the sulphur from refinery bottoms as high sulphur fuel oil. But the International Maritime Organisation has now mandated a reduction in sulphur content of marine fuels to 5,000 ppm (0.5%) globally, and 1,000 ppm (0.1%) in heavily trafficked regions which have instituted Emissions Control Areas (ECAs). Ships can meet the standards using a variant on FGD (scrubbers), but so far only around 15% of the world’s ships do so. This has led to a boost in production of vacuum gasoil and low sulphur fuel oil, and a corresponding increase in sulphur production at some refineries.
Industry
Power-intensive industries are also a major source of SO2 emissions. Cement and lime production have generally installed scrubbing systems similar to power stations, but metal smelters often generate large amounts of SO2 , and given the age of many smelters, these have often operated without effective pollution control, becoming a major bone of contention with local communities. This has even enforced the shutdown of smelters on occasion, such as at Tuticorin in India and La Oroya in Peru. Some smelters, such as Norilsk in Russia, are among the top SO2 emitters in the world, generating 1.9 million t/a of SO2 alone in 2019. But SO2 capture systems are progressively being added around the world to older smelters, and mandated for new ones. For example, Chile recently went through a programme of fitting SO2 abatement to its smelters. This generates an increasing proportion of the world’s sulphuric acid – around 35% at present. Norilsk also aims to reduce its SO2 output by 90% by 2025, though, because of its remoteness, the company is taking a different tack, and will neutralise the acid to produce gypsum.
Emissions from the oil and gas industry as a by-product of recovering sulphur at refineries and gas plants also remain a major emitter of SO2 . Numbers 3 and 4 on the list of global SO2 ‘hotspots’ are the Zagroz petrochemical complex in Iran and the Rabigh complex in Saudi Arabia, and installations in Mexico and the UAE are also in the top ten. Saudi Arabia is actually another of the countries where SO2 emissions are still rising, and there is growing pressure on these countries to reduce this.
More sulphur?
UN figures indicate that, while global population increased from 4.4 billion in 1980 to 7.4 billion in 2015, and global GDP rose from $11.4 trillion to $75 trillion (in 1980 dollars) over the same period, global man-made sulphur dioxide emissions fell from 151 million t/a to 73 million t/a over the same period – more than halving. This reduction in sulphur dioxide amounted to 78 million t/a, equivalent to 39 million t/a of elemental sulphur. And perhaps far from coincidentally, the total amount of recovered sulphur being produced rose during that period by 29 million t/a, from 33 million t/a in 1980 to 62 million t/a in 2015. While FGD in the power sector generates gypsum as a by-product, and hence is tangential to the sulphur industry, sulphur dioxide emissions control at refineries and gas plants will generate additional sulphur, and, from metal smelters, sulphuric acid.