Fertilizer International 523 Nov-Dec 2024

30 November 2024
Sulphur – inventory, availability and pricing
CRU INSIGHT – SULPHUR
Sulphur – inventory, availability and pricing
Significant changes to the level and location of sulphur inventory over the last two years have caused swings in short-term supply availability. Inventory plays a necessary role in balancing the sulphur market but exactly when, where, how, and why inventory enters the market can trigger a diverse range of price responses. In this insight article, CRU’s Peter Harrisson looks at how inventory change influences sulphur availability and pricing.
The sulphur market is in a constant state of structural imbalance as supply and demand movements are driven by different economic drivers. This creates a frequent flip-flop between surplus and deficit, with inventory being necessary to manage this volatility in availability.
How does the sulphur market balance?
Most sulphur supply originates as a by-product of oil and gas production with the volume of sulphur produced being independent of the demand for the product. Sulphur demand is driven by a diverse range of industries with the dominant sectors focused on fertilizer, metals and industrial markets. There is an underlying link between sulphur supply/ demand and overall economic activity, but the exact influence of this on each sector is not identical.
Given the inherent disconnect between supply and demand, the sulphur market is in a constant state of flux between surplus and deficit (see Fig. 1). According to CRU data (see Fig. 2), since 1990, the sulphur market has been in a deficit for 15 years and in surplus for 20 years, with an average balance of 0.37 Mt. The range of supply imbalance has been between a peak surplus of 4 Mt and a deficit of 2 Mt with the annual market balance, as share of market size, averaging 1%. The state of physical surplus and deficit necessitates that inventory be built and drawn down to allow supply to meet demand.


Where and why is inventory built?
Historically, sulphur inventory has been built at production sites with remote geographical locations and insufficient access to logistics. The largest accumulation of sulphur in long-term storage is in Alberta, Canada, at oil sands operations. There has also been stock accumulated in Kazakhstan, at the Kashagan operation, and in Saudi Arabia at the Berri gas plant. Canada’s stocks have been built over many years but the accumulation of volumes at Kashagan and Berri has been a more recent trend. There are also other locations with inventory throughout the Middle East and Central Asia.
Prior to 2020, most of the inventory management happened at production sites with increased sales in times of deficit and increased stock build in times of surplus. However, China has begun to play a more active role in inventory management. China has operated a system of port inventory for many years, but this stock would typically not exceed 1.5 Mt, equivalent to 10-15 % of annual imports. However, since 2020 China has twice accumulated over 3.0 Mt of inventory, equivalent to 30-35% of annual imports (see Fig. 3).

How has the behaviour of stockholders changed?
The upswing in the level of inventory held in China is partly the cause and partly a symptom of a wider shift in stockholder activity. Throughout 2020, stocks steeply increased in response to falling prices, concerns over logistics and speculative buyer behaviour. The fall and subsequent rebound in stock levels followed the upswing and retreat in sulphur pricing, but also continued to incorporate an element of speculative purchasing behaviour.
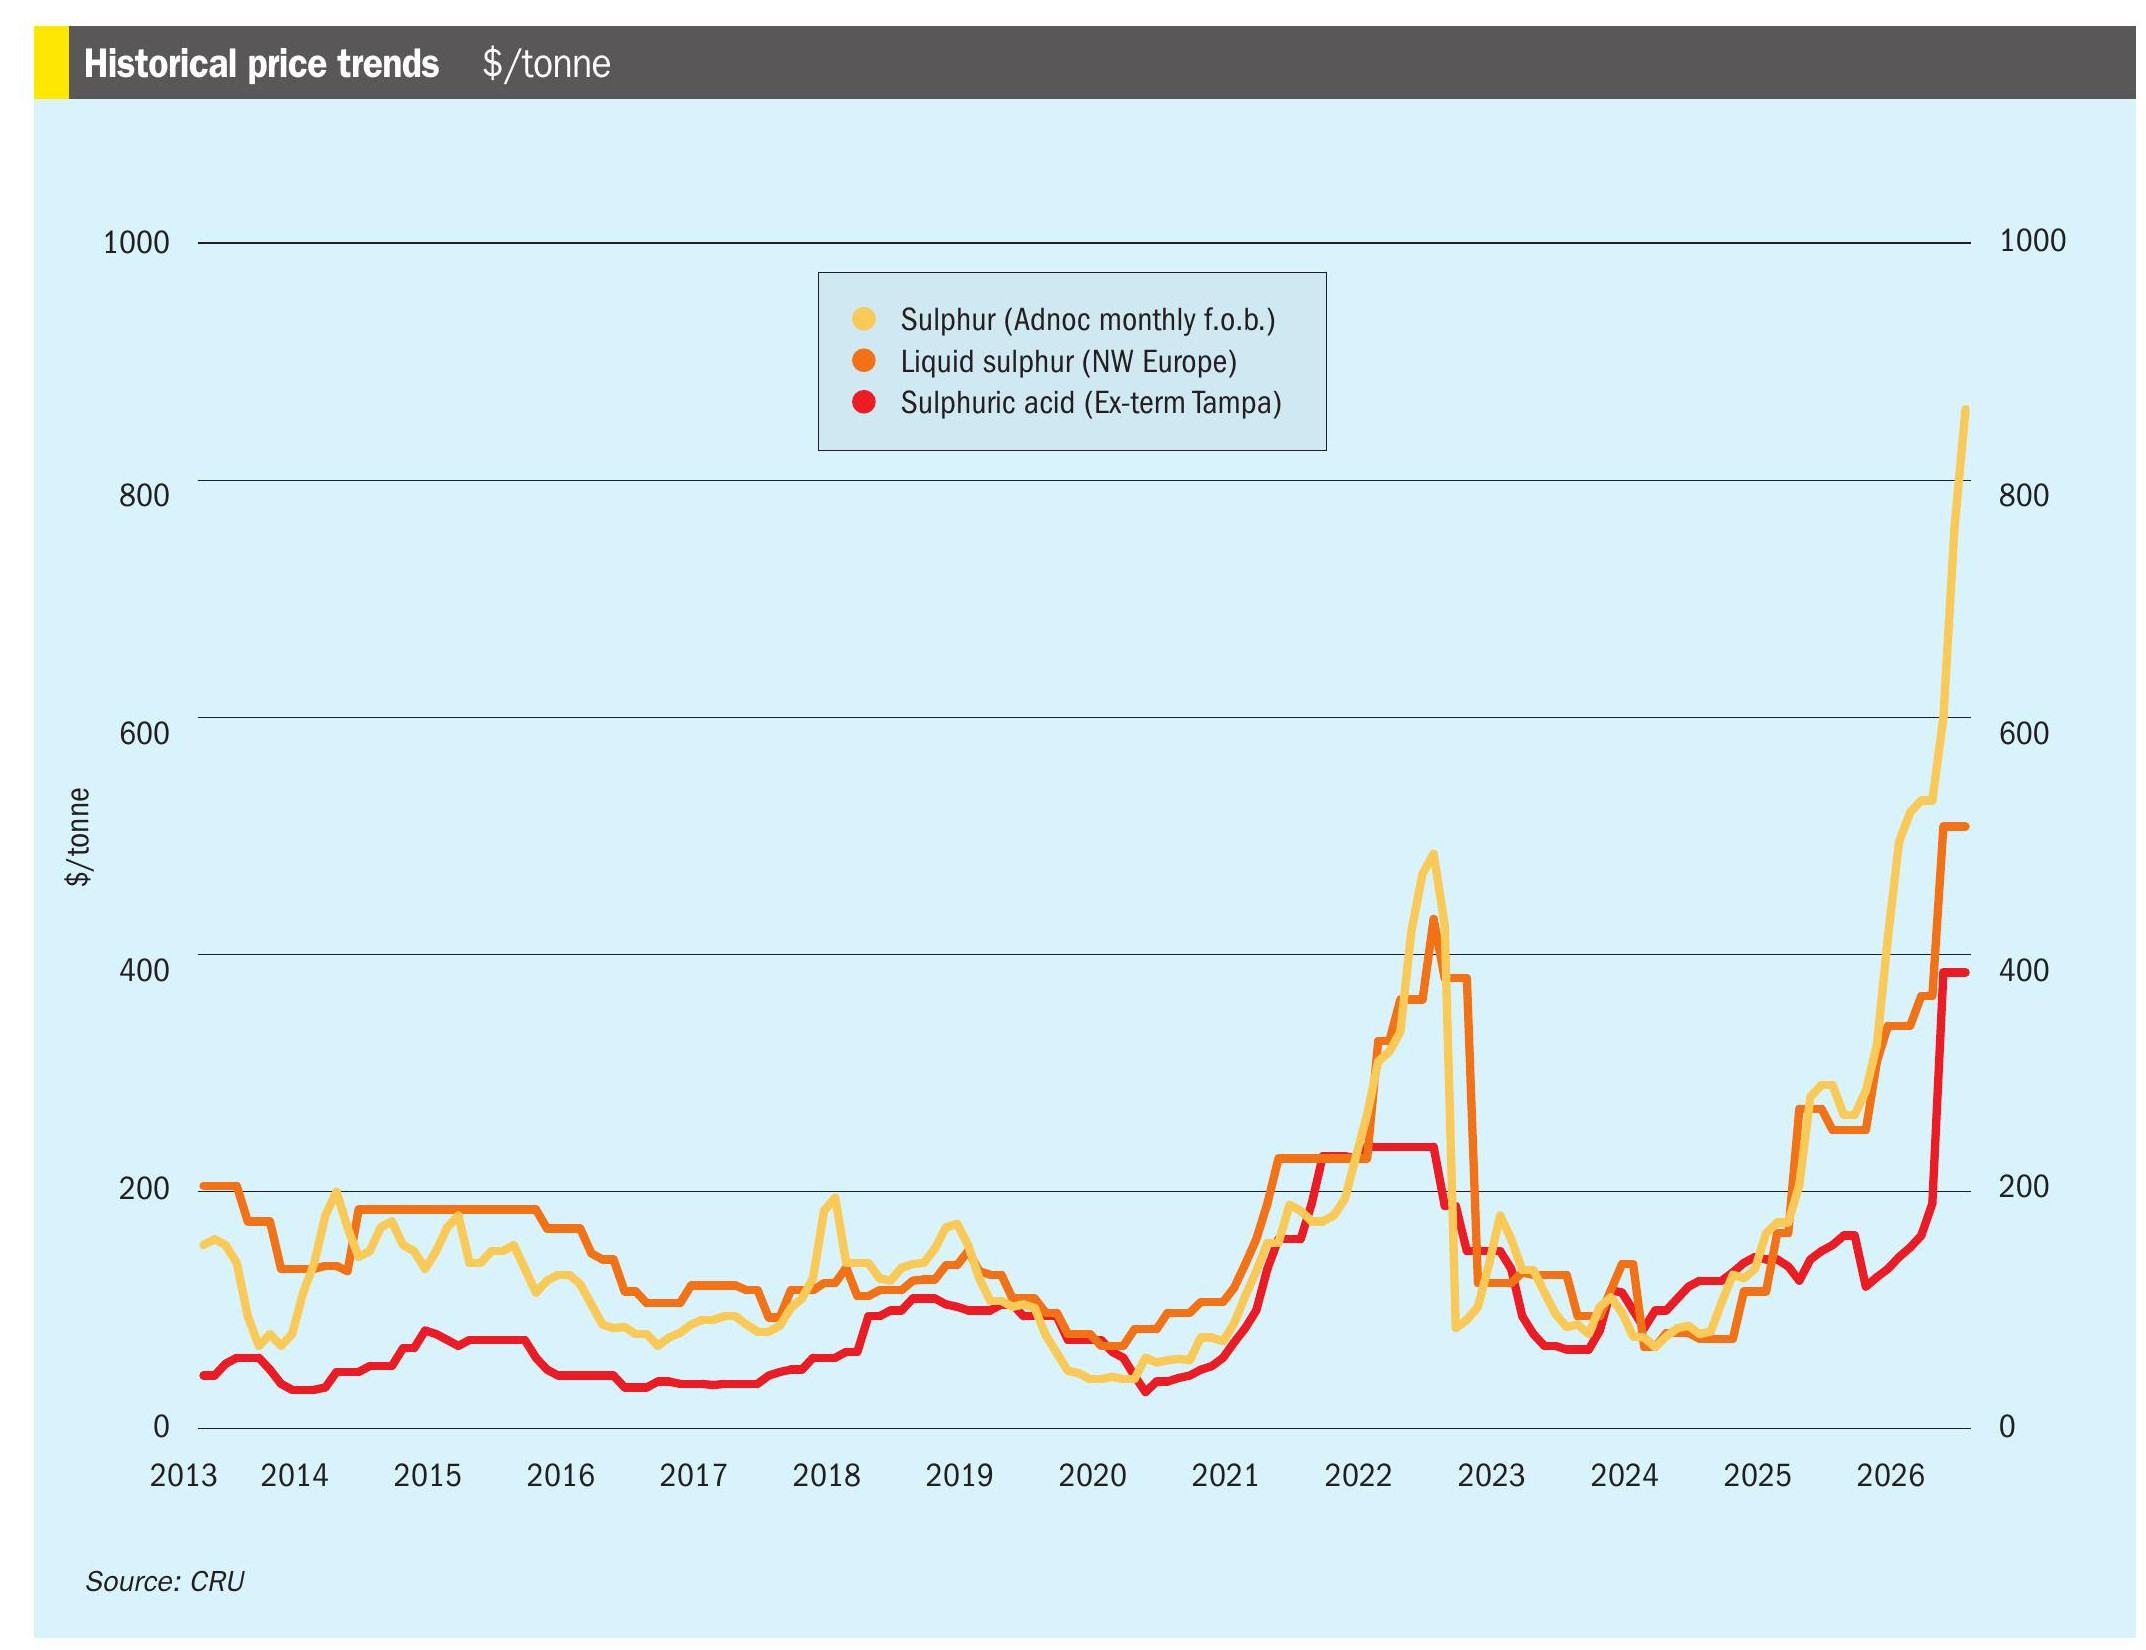
The increase or decrease in stocks has responded inversely to the trajectory of sulphur prices. The last time a programme of consistent stock drawdown occurred was from 2020 to 2022 when stocks declined from a high of 3.0 Mt to 1.3 Mt (see Fig. 4). In total, port inventory dropped by 1.7 Mt in around two years. This time frame coincided with a significant jump in China CFR prices from an average of $76/ t in 2020 Q3 to $492/ t in 2022 Q2. After the stock peak, prices reversed their upward trajectory and were depressed throughout 2023, which triggered stock build-up up to April 2024. Strong demand from China has pushed sulphur prices up since July, and port inventory levels have started to fall again.

Since late 2022, there has been a shift in the overall market dynamic as the market has entered a period of global surplus and lower prices. However, this period has also coincided with an increase in voluntary stock drawdown in Kazakhstan and Saudi Arabia (see Fig. 5). It is typical for a global net-surplus to be composed of both supply locations which are building inventory and others in the process of drawing down stocks. However, this is typically still price driven. Canada’s stock drawdown behaviour has followed the price trend, with periods of high prices driving increased drawdown and low prices slowing additional sales. By contrast, higher Kazakhstan and Saudi Arabia exports since 2023 Q2 have coincided with a period of lower pricing. The objective in both locations has been to decrease the volume of supply held in inventory. In Saudi Arabia, this has been due to the current stock location nearing capacity and therefore the strategic benefit of managing logistics outages has diminished. Saudi Arabia has added around 0.15 Mt /quarter to its export programme from stock drawdown. In Kazakhstan, meanwhile, the trigger of stock decline has been regulatory risk. Stock at Kashagan was accumulated in the early years of operation, when export logistics were yet to be completed. Kazakhstan has a long-held aversion to the long-term storage of sulphur with regulatory pressure triggering the sale of 9.5 Mt of sulphur inventory from 2005-2015. The most recent pressure on Kashagan’s sulphur inventory came in the form of the announcement of a significant fine from the Kazakh government due to the accumulation of 1.7 Mt of stock at the site.

This has triggered a concerted effort from the operators of Kashagan to start a programme to remove the accumulated inventory. The programme of stock removal has increased exports from Kazakhstan by around 0.25 Mt /quarter with the total inventory expected to be depleted by mid-2025.
How will stock change influence the market in 2025?
The presence of high inventory in China and the programme of proactive stock drawdown in Saudi Arabia and Kazakhstan will continue to place a negative pressure on prices. However, the current rally in sulphur prices, driven by resurgent demand, illustrates the difference between short-term sentiment and overall trend. The other point shown by the recent price increases is that proactive stock drawdown and price surges can coincide with each other. The determinant of this relationship is the overall market balance trend. The global sulphur market has entered a period of resurgent demand growth and slowing supply increases, with the global balance expected to move into deficit in 2025. The result is that proactive stock drawdown will be a necessary feature of the market and will not put downwards pressure on prices, as was the case in 2024 H1. The status of China’s inventory will continue to hang over the market as the current 2.6 Mt level is equivalent to 2-4 months of imports. Especially as these volumes give Chinese consumers and traders more choice over if, when and how much they enter the international traded market.
About the author

Peter Harrisson is CRU’s Principal Analyst – Sulphur and Sulphuric Acid Fertilizers.
Email: peter.harrisson@crugroup.com Tel: +44 20 7903 2249