

Nitrogen+Syngas 394 Mar-Apr 2025

19 March 2025
Challenges of a green ammonia economy
GREEN AMMONIA
Challenges of a green ammonia economy
While green hydrogen and green ammonia promise to be important clean energy carriers in future, there are significant challenges to be overcome not only in production storage and transport, but also financially realising the project. Innovate technology from thyssenkrupp Uhde, embodied in standardised, pre-integrated, modularised plant can deliver low cost of ownership and de-risks execution.
Green ammonia produced with renewable energy can be used to decarbonise the fertilizer industry, used as a carbon-free fuel or as a carrier for hydrogen. While green hydrogen and green ammonia promise to be a clean energy carrier, there are significant challenges to be overcome not only in production storage and transport, but also financially realising the project. This has resulted in slow market development to date.
Drivers of the slow market development
One driver for the slow market development are technology integration and execution risks. The financing institutes seek project bankability. For this the end-to-end performance must be proven, the costs and schedule must be manageable and safely estimated. This requires execution-ready solutions to lower the cost of capital for the project developer.
The second driver is the high cost of green ammonia production. If there are no governmental subsidies available, the levelised cost of green ammonia production is two to three times more expensive than the levelised cost of ammonia produced in a conventional ammonia plant which utilises natural gas as feedstock. The high production cost of green ammonia is caused by the price of renewable power. Assuming a specific power consumption of 10 MWh per ton green ammonia produced and a specific power price of 30 EUR/ MWh, this alone leads to an expenditure for electricity of 300 EUR per ton of ammonia! To make matters worse the renewable power is intermittent so that the average plant utilisation is not 100% of its design capacity. This leads to higher specific investment costs per ton ammonia which has a direct impact on the levelised cost of green ammonia production.
The third driver is the variability in definition of clean hydrogen. For example, in South Korea hydrogen with a carbon intensity of 4 kg CO2/kg H2 is considered as clean while in the EU hydrogen with a carbon intensity of only 3.38 kg CO2/kg H2 is considered as clean. While the US Inflation Reduction Act will give the best tax credits to hydrogen produced with the lowest emissions, its proposed clean hydrogen production standard lends credibility to hydrogen produced with only a 64% decrease (4 kg CO2/kg H2) compared to grey hydrogen made from fossil gas. It is the same for Canada’s Clean Hydrogen Investment Tax Credit (CHITC) where government subsidies will be available for hydrogen produced with 4 kg CO2/kg H2. The UK Low Carbon Hydrogen Standard considers hydrogen with a carbon footprint of less than 2.4 kg CO2/kg H2 as clean. There are different definitions of which types of CO2 emissions are to be considered when calculating carbon intensity. This could be a life cycle analysis (LCA) where not only the direct CO2 emissions during production are taken into account but also the CO2 emissions during fabrication of the plant itself and its parts. Another definition “well to gate” includes emissions derived from the production and transport of inputs used in the production process, e.g. generation of electricity with fossil fuels. Additionally, the CO2 emissions arising from shipping the produced ammonia can contribute to the carbon intensity. Also, the time matching – the alignment of energy consumption for production of green ammonia with renewable energy production on an hourly (or even more granular) basis – is tied to subsidy schemes, e.g. Renewable Energy Directive III (RED III) of the European Commission. The third driver has an early influence on the technical concept, e.g. how fast must the electrolyser respond to changes in renewable power.
The fourth driver is the slow roll-out of policy seeding incentives. Policy support is limited to a few regions and trading chains, e.g. US (US National Clean Hydrogen Strategy and Roadmap, June 2023, Infrastructure Investment and Jobs Act, Inflation Reduction Act), EU (REPowerEU Hydrogen Policy, 2020, Hydrogen Accelerator plan, European Hydrogen Bank, 2023), China (China’s Hydrogen Industry Development Plan, 2022), India (India’s National Green Hydrogen Mission, 2023), Australia (Australia’s National Hydrogen Strategy) and South Korea (First Basic Plan for the Implementation of the Hydrogen Economy, November 2021).
All four drivers for the slow market development have a strong impact on the feasibility of a green ammonia project and influence the investment decision of project developers.
Techno-economic concept development
There are different sources of renewable energy available. The renewable energy source which is most reliable and predictable is hydro power. Here the timescale for changes of available hydro power is in the range of months. The power profile of solar power is to some extent predictable but it hourly changes and during nighttime there is no energy at all. Wind power is less predictable and the timescale for changes of available wind power is in the range of hours.
Generally, three different concepts for an integrated power-to-ammonia plant are possible:
• Grid connected: The operator of the green ammonia plant obtains the required electricity exclusively from an existing power grid with a power purchase agreement or buys renewable energy at the spot market. This has the advantage that there is always power available. However, the power price can fluctuate depending on the season or time of day. Then the spot price for renewable power can trigger the operation of the plant for arbitrage. If the spot price is low, the hydrogen production and ammonia plant are operated at maximum capacity and the hydrogen inventory is filled up. If the spot price is high, the electrolysis and ammonia plant are operated at minimum turn-down ratio and the hydrogen storage tank is emptied. Grid connection enables a steady or with a low frequency cyclic ammonia production.
• Island mode with battery: The green ammonia plant is connected to a dedicated wind or/and solar park, a battery provides power in case of unavailable renewable energy. The size of the battery is only sufficient to operate the plant at minimum turn-down ratio or in hot-standby-mode where no ammonia is produced, and the ammonia loop is kept at catalyst light-off temperature so that ammonia production can be resumed quickly when renewable energies are available again in sufficient quantities. The power input to the plant is highly fluctuating and as a result the production profile of hydrogen and ammonia has a high intermittency.
• Hybrid – island mode with grid: The green ammonia plant is connected to a dedicated wind or/and solar park and to an existing power grid. If renewable power is high, no power from the grid is fed into the ammonia plant. If there is little or no renewable power available, the operator obtains electrical power from the grid. The level of ammonia production can be determined by current electricity price. The combination of island mode and grid enables an ammonia production profile with moderate intermittency.
More considerations may be important during the concept development phase. Concurrent variables affect the project viability, e.g. a project is more feasible in a country where subsidies are high and a market for green ammonia exists than in a country where there is no strategy for subsidising ammonia produced with renewable energy and there is no buyer for green ammonia. Energy intermittency may be deliberate – lower power consumption with high electricity prices, or natural – caused by a wind calm or cloud field. Energy intermittency leads to uncertainty regarding the energy pattern and price of renewable energy. Energy intermittency also influences the size of energy storage. A renewable power profile which is less fluctuating requires less battery and hydrogen storage than a strong fluctuating power profile. The size, form and technical readiness level of the hydrogen storage contributes to the cost of the storage and thus directly to the capital expenditures of the plant. The offtake pattern may be constant (if there is another plant on site which uses ammonia as a feedstock) or diurnal (if the ammonia is transported by truck) or seasonal (to meet the demand of agriculture). The offtake pattern has a direct impact on the size of ammonia storage in the plant. Finally, the ammonia to be produced can be subject to carbon intensity restrictions, e.g. if the carbon intensity for hydrogen must be low in order to receive subsidies or the electrical power must contain a lower share of “grey” produced power as if there were no carbon restrictions.
During development of the techno-economic concept the following topics have to be solved:
• What does the optimal flowsheet look like and what is the optimal production capacity of the ammonia plant? Is hydrogen storage required?
• How to reduce the production cost? For example, production capacity of ammonia plant is adjusted to power price.
• How does the offtake pattern influence cost? For example, the size of the ammonia storage tank is influenced by the offtake pattern.
• What is the best geo-spatial site setting? For example, a good site setting would be a location where is a good mix of solar and wind energy is available and which is close to the off taker of ammonia.
• How to handle future expansion scenarios? For example, acquiring sufficient land from the outset for the installation of additional equipment.
• How to comply with the carbon intensity limits? For example, when concluding the power purchase agreement, determine how high the proportion of grey electricity may be.
thyssenkrupp’s RHAMFS® tool can help to solve these topics. It is founded on decades of technology and integration know-how. It is built for holistic, fast, and credible techno-economic analysis. It enables the concurrent modelling of multi-variable “what-if” scenarios. Based on the total cost of ownership it identifies the optimum end-to-end concepts. The profile of renewable power supply can be configured as a mix of solar, wind and hydro power. Using the time-dependent power profile as input, the hydrogen production and the ammonia production are dynamically modelled. Hereby the hydrogen storage is optimised with regard to size and storage pressure. Parameters, such as size of electrolysis or capacity of ammonia plant, are systematically varied to find the minimum of the specific ammonia production cost.
The following example illustrates the typical results of a RHAMFS® study for a green ammonia plant with a nominal design capacity of 2,400 t/d. Fig. 2 shows the profile of the renewable energy (light grey) and the actual ammonia production (dark grey) for a whole year. The nominal capacity is indicated by a red, constant line and the average ammonia is indicated by a green, constant line. The minimum turndown of the plant is 40% of nominal design capacity.
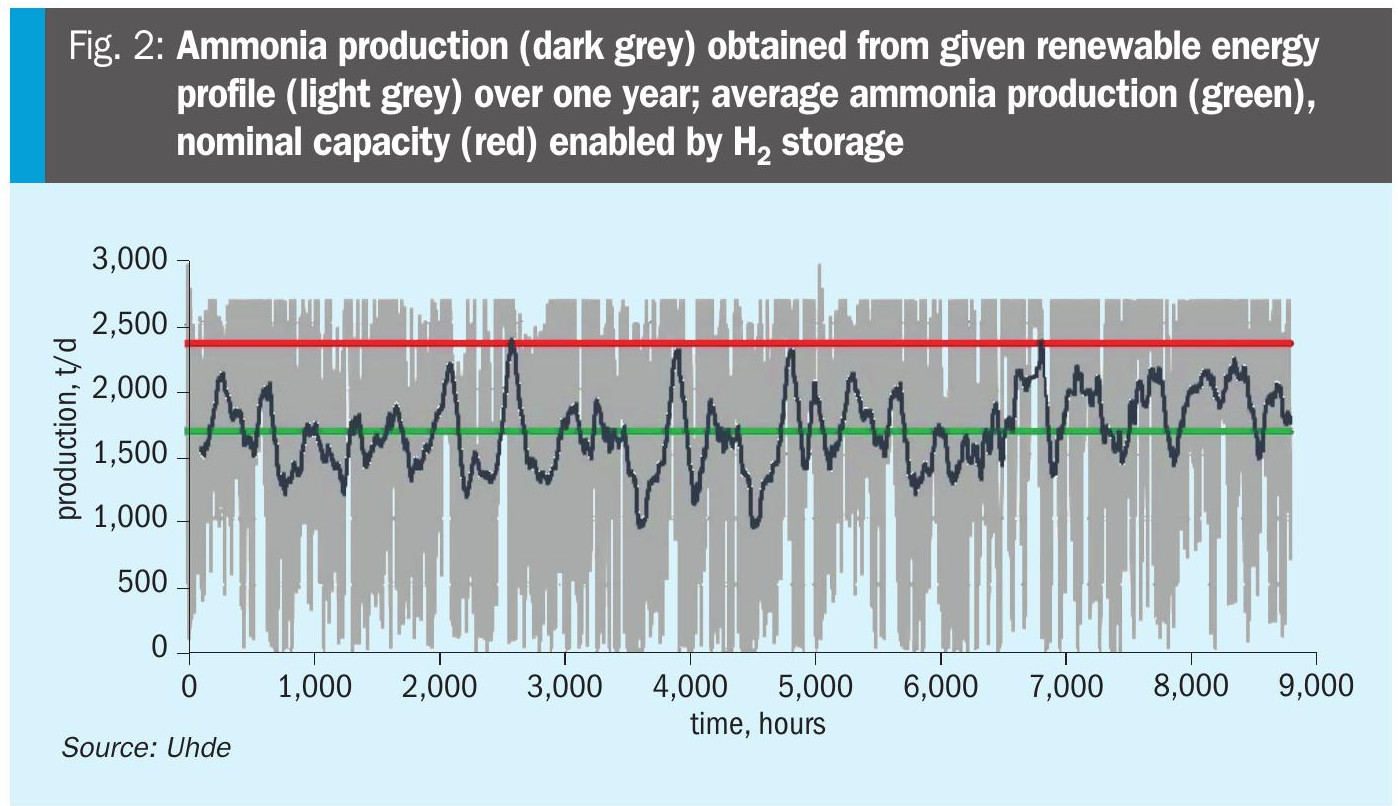
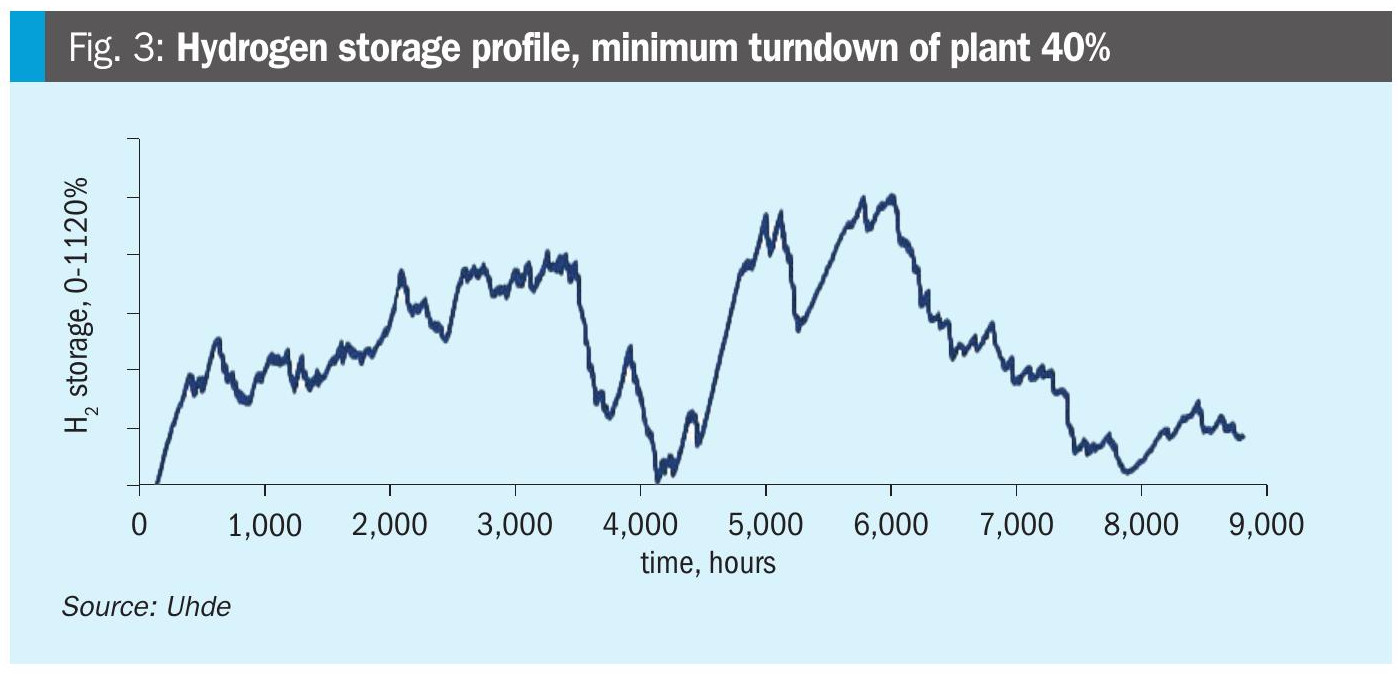
Fig. 3 shows the corresponding amount of hydrogen stored in the hydrogen storage vessels over one year. Hereby 100% correspondents to the maximum amount of hydrogen stored in case of 2,400 t/d plant with minimum turndown ratio of 40%.
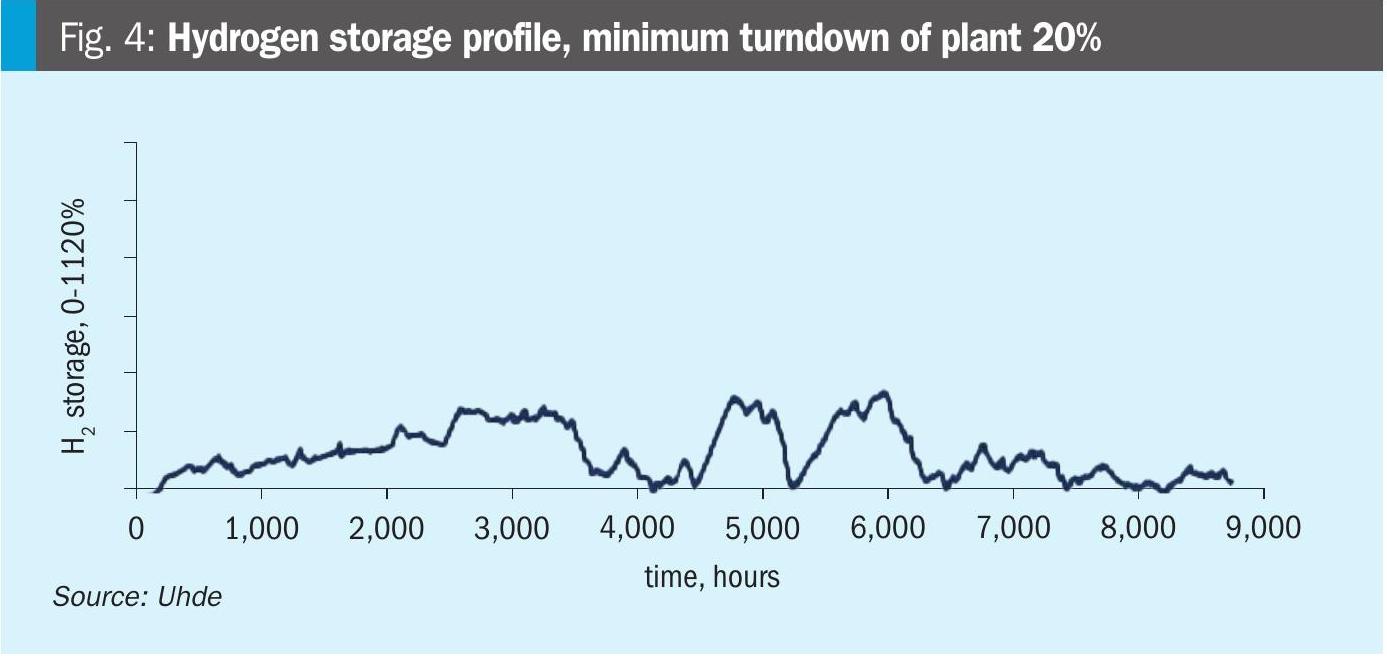
If the availability of renewable power is the same, but the plant is operating between 100% and 20% turndown, then the maximum production capacity of the plant can be slightly smaller and the peak storage requirement is more than halved as shown in Fig. 4.
Technology and execution solution focus
The economics of green ammonia production drive thyssenkrupp Uhde’s technology and execution solution focus.
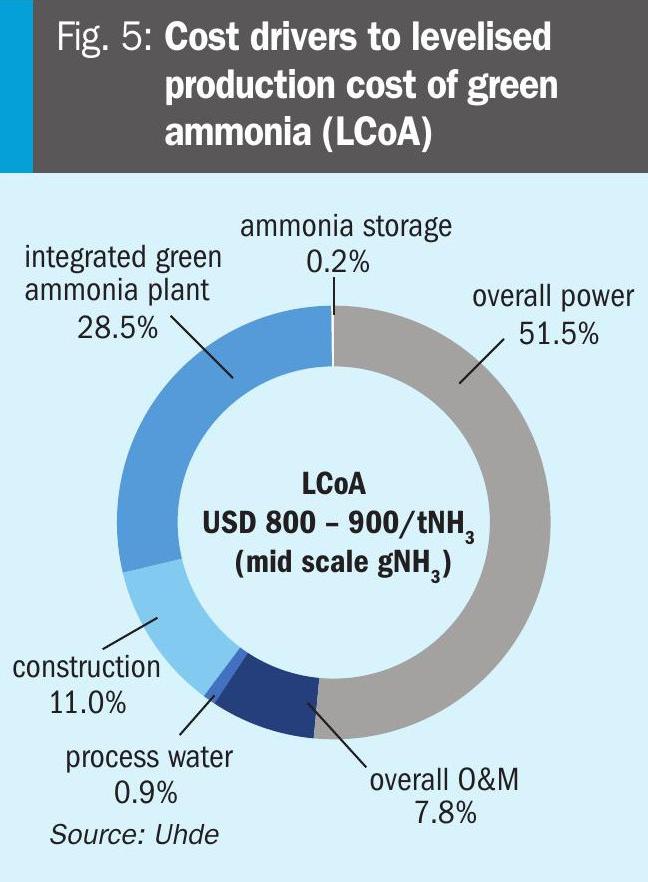
Fig. 5 shows the cost drivers for the erection and operation of a green ammonia plant. The levelised cost of one ton of green ammonia (LCoA) produced is between 800 and 900 USD for a mid-scale green ammonia plant. Hereby the energy consumption accounts for 51.5% of the costs. The engineering and procurement of the integrated green ammonia plant accounts for 28.5% and the construction share is 11%. The proportion of operating and maintenance amounts to 7.8%. Minor contributors to the production cost of ammonia are process water with 0.9% and ammonia storage with 0.2%.
The main focus is the power costs. A location should therefore be found where the price of renewable energy is low. The available renewable power must be utilised to a high degree. This can be achieved by a high flexibility (a high turn-down-ratio) und efficiency of the plant. This means a high conversion of hydrogen to ammonia and a low specific energy consumption of the plant. Curtailment of renewable energy is a clear drawback which can be mitigated by battery and hydrogen storage.
Another significant cost driver are the capital expenditures of the integrated green ammonia plant. The capital expenditures of the ammonia plant itself, but not the electrolysis, obey the economy of scale. Therefore, it is advantageous to build large scale ammonia plants with a production capacity larger than 1,000 t/d. The hydrogen storage should be minimised with the help of RHAMFS® tool. An ammonia plant with a high degree of standardisation results in cost savings in engineering and procurement.
Construction cost on site may be high, especially in countries with high labour rates. There is also the risk that the schedule will not be met. These risks can be avoided if the plant is modularised and standardised to a high degree. The modules can be prefabricated in a module yard. The production conditions here are better than on the construction site so that quality can be improved, and schedules are easier to meet. Preferably, module production takes place in low-wage countries to reduce module fabrication costs. The finished modules can then be shipped to the construction site. The dimensions of the modules can also be selected so that they can be transported by truck.
Operation and maintenance costs also make a noticeable contribution to the LCoA. These can be addressed by a high degree of automation and digitalisation. Automation and digitalisation enhance the operability and safety of the plant.
Dynamic green ammonia process technology
The intermittency of renewable energy poses technical challenges for green ammonia synthesis, which are not fully addressed via the conventional plant design approach. For obtaining the same ammonia production out of a given profile of power over time, one is moving between two extreme cases:
• Oversizing the plant (electrolysis and ammonia plant) to time shift hydrogen availability: high underutilisation over long intervals: cost penalty.
• Sizing the plant for average availability of power: Large hydrogen buffer storage required: cost penalty.
Fluctuating hydrogen production also poses a risk to the safe operation of the ammonia plant. When the operating parameters of the ammonia plant are not adopted to the varying feed flow rate of hydrogen there is the possibility of reaction snuff-out. In case of unstable reaction temperature, the catalyst can be damaged by thermal cycling. A varying synthesis pressure can lead to a loss of containment due to pressure cycling fatigue.
All these topics tend to increase the levelised cost of ammonia and have to be addressed by a dynamic green ammonia process technology during the plant design.
The key technology blocks are the power generation from renewables, the battery for energy in case of curtailment of renewable energy, the hydrogen production by electrolysis, the hydrogen storage in case of less or no hydrogen production and the ammonia plant itself. RHAMFS® is the system sizing tool which carries out an optimal sizing of these key technology blocks. It should be used early in the project development phase to optimise the concepts for the lowest LCoA.
The varying hydrogen feed flow from electrolysis requires an adjustment of the ammonia production capacity. This dynamic load management has been especially developed for green ammonia plants. Dynamic simulations, encompassing power supply to the ammonia production, have been carried out to develop new design features like the patented so-called “Master Controller”. A principle sketch of the Master Controller is shown in Fig. 6.
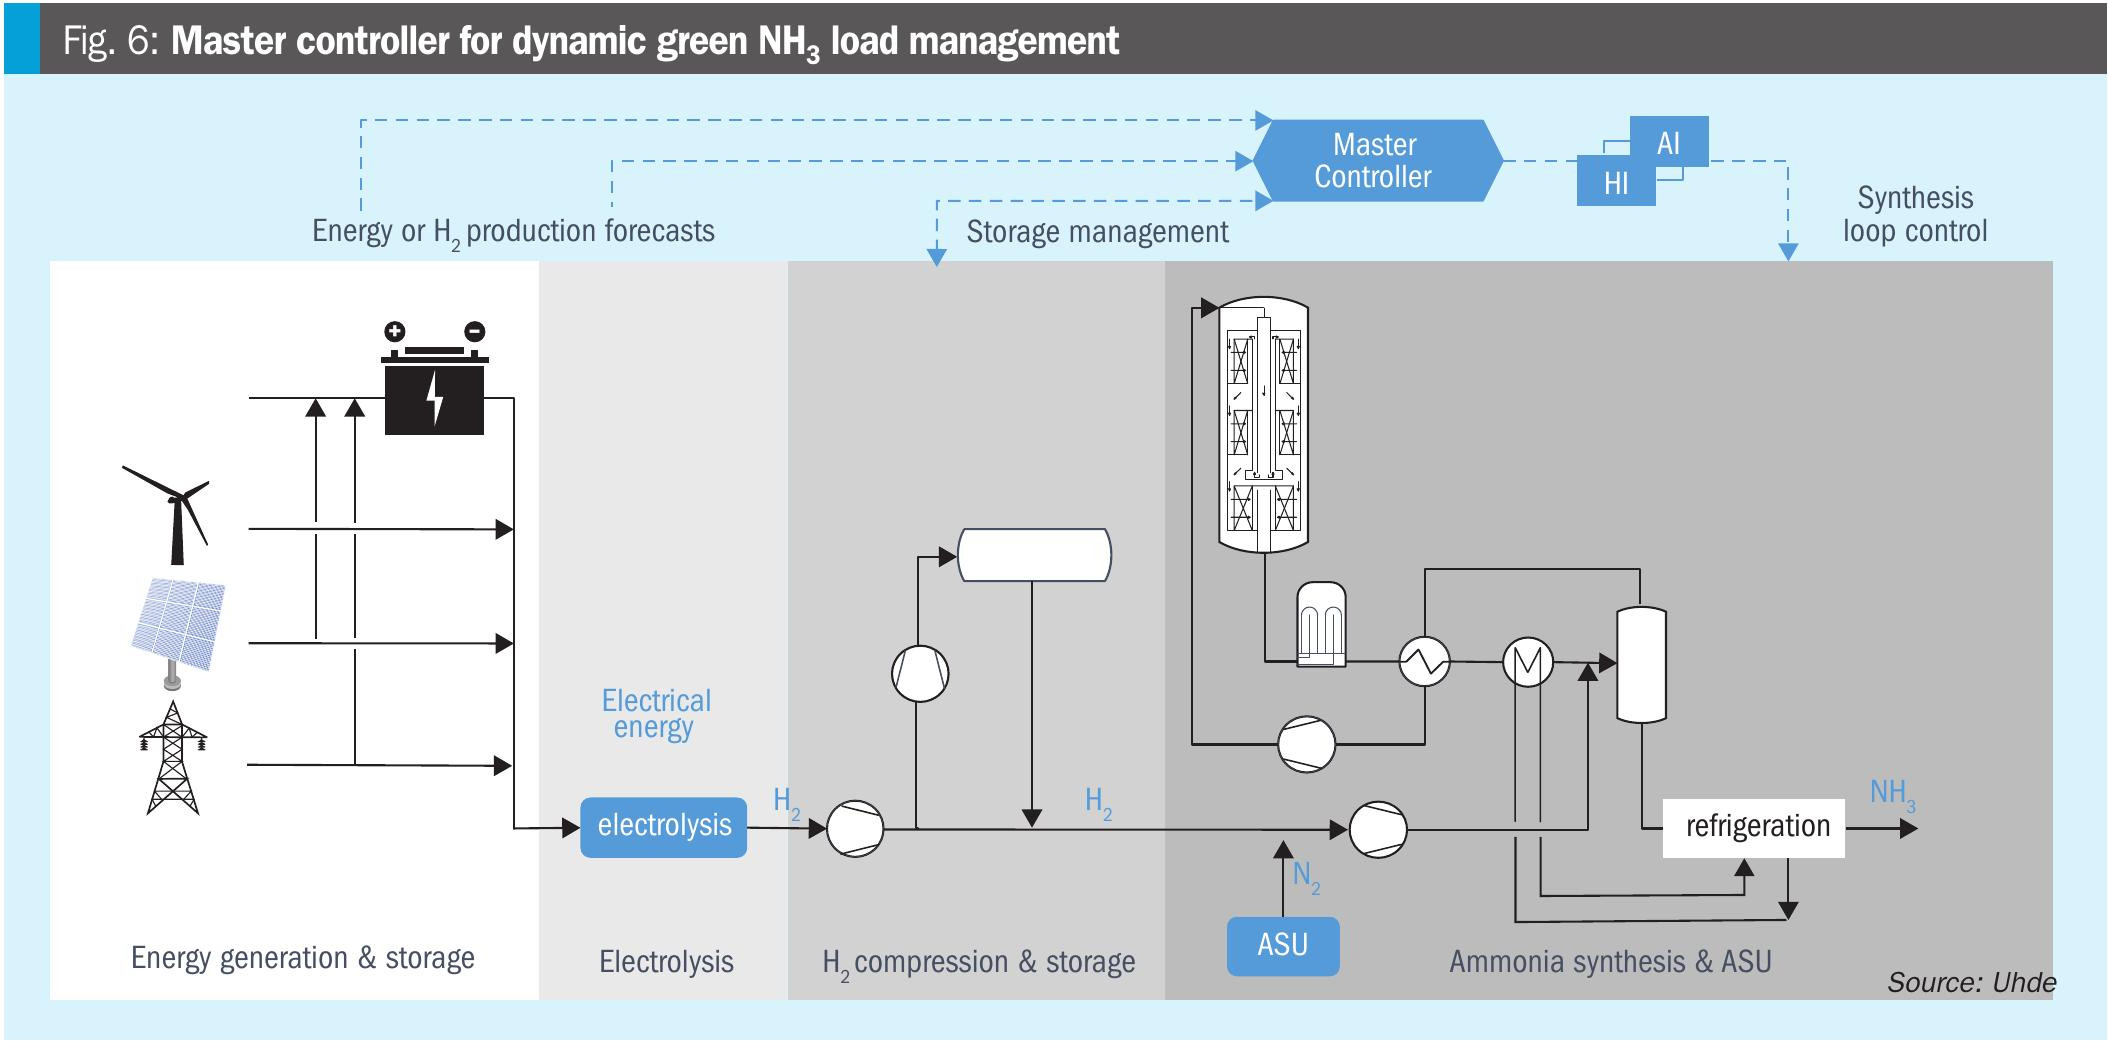
Energy is provided by renewables such as wind or solar or from a power grid. The electrical energy is used by the electrolysis for the production of hydrogen. The hydrogen is compressed in a hydrogen compressor. The pre-compressed hydrogen is fed to the suction side of the synthesis compressor, but a portion can be diverted by the hydrogen storage compressor to the hydrogen storage vessel. The hydrogen is mixed with nitrogen from the air separation unit (ASU), the H2/N2 mixture is compressed by the synthesis gas compressor and fed as make-up gas into the synthesis loop. In the synthesis loop ammonia is formed in the converter with one or more radial catalyst beds and condensed by the refrigeration system.
The Master Controller needs as input the forecast of the generation of renewable energy or the amount of hydrogen produced by electrolysis. Although the renewable energy, which can be a mix of solar and wind, are fluctuating, a reliable four-hour forecast is possible. Even if the plant is connected to a power grid, this does not mean that hydrogen production is constant. The prize for electrical power can change and adjusting the production capacity for arbitrage may be advantageous. It may also be necessary to adjust production capacities in the event of load shedding. The Master Controller actively manages the hydrogen storage. In the event of high hydrogen production, it fills the hydrogen storage vessel; in the event of low hydrogen production, the Master Controller empties the hydrogen storage vessel. Knowing the current amount of hydrogen produced and the amount of hydrogen stored, the Master Controller determines the amount of hydrogen to be fed into the ammonia plant, thereby also determining the ammonia production. The Master Controller also controls the ammonia plant. It adjusts several operating parameters of the synthesis loop to the varying hydrogen feed flow rate. The Master Controller controls the inlet temperature to the ammonia converter and to the catalyst beds and maintains it above set-off temperature of the catalyst so that the reaction is not snuffed out. This is achieved by reducing the steam production so that less heat is extracted from the synthesis loop and remains available for reheating the cold synthesis gas. An electric preheater is switched on at very low partial loads. The pressure is controlled by reducing or increasing the recycle flow-rate through the ammonia converter via a spill-back valve in parallel to the antisurge valve of the recycle compressor. The loop pressure is also controlled by a bypass around the cooling train of the synthesis loop. Hereby the ammonia concentration at the inlet of the converter is increased and less ammonia is produced per pass through the converter so that the amount of hydrogen and nitrogen converted to ammonia matches the flowrate of hydrogen and nitrogen that enters the loop. By this means the Master Controller ensures a safe operating envelope and a steady pressure in the synthesis loop. In accordance to ASME code Sec. VIII pressure cycles which are less than 15% of the design pressure do not have to be considered during the design of the pressure vessels in the synthesis loop. A dynamic simulation of the synthesis loop has been carried out to study the pressure fluctuations. The results are shown in Fig. 7.
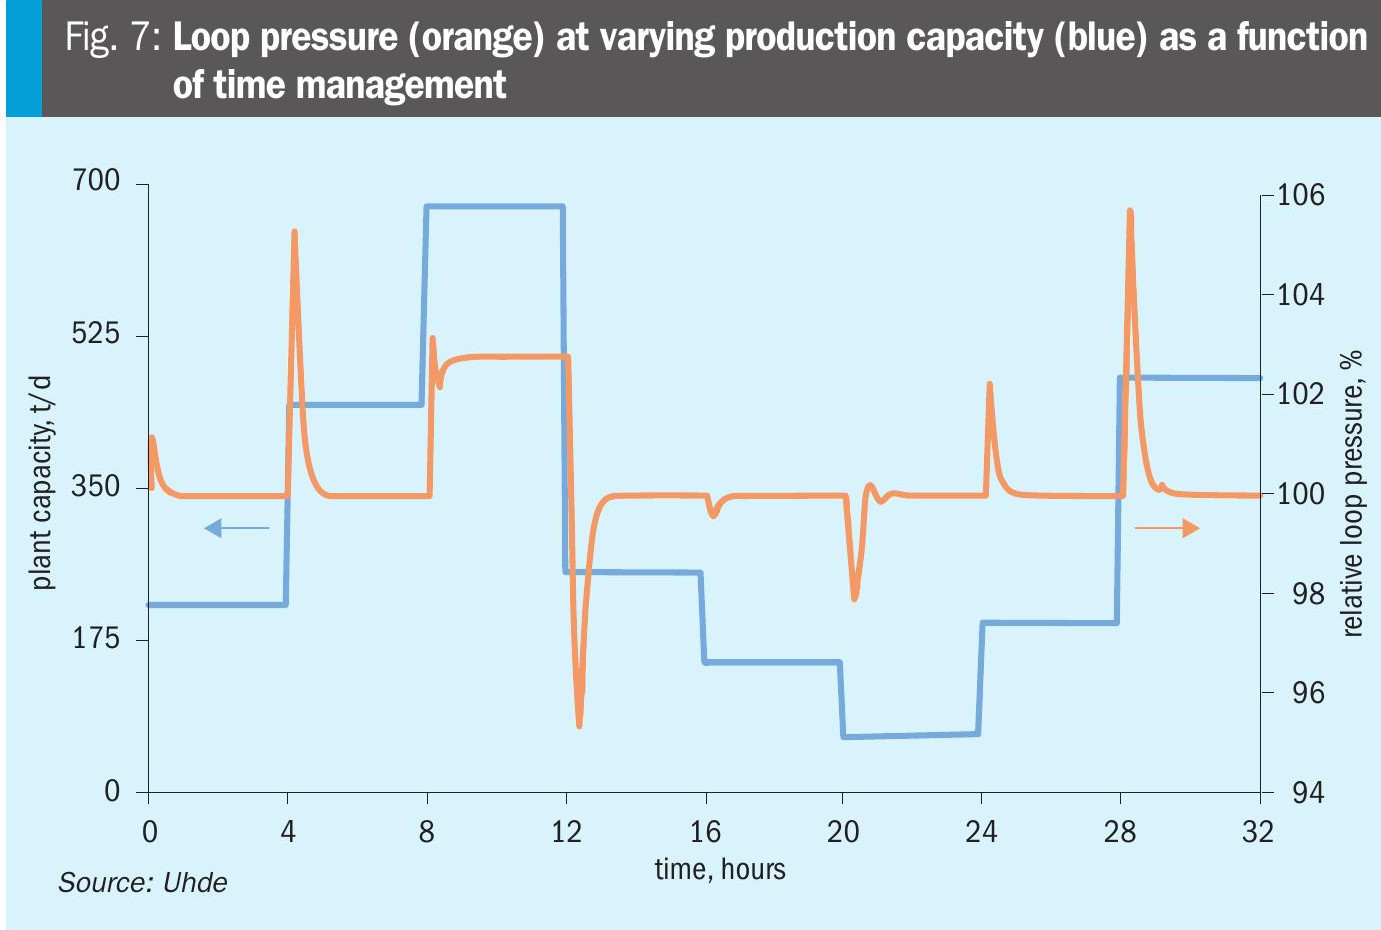
Using a real power profile the plant capacity has been varied every four hours in the range from 10 to 100% (blue line) of plant capacity 675 t/d and the Master Controller controls the loop pressure (orange line). The set loop pressure is at 100%. The diagram shows that the loop pressure does not deviate more than 5% downwards and 6% upwards from the set loop pressure. This proves that the developed Master Controller concept can cope with fluctuating renewable energy.
The Master Controller is able to keep the temperatures and pressures in the synthesis loop within an acceptable range even if the hydrogen supply fluctuates. Thus, the catalyst is not damaged by thermal cycling and loss of containment due to pressure cycling fatigue does not occur. The ammonia production follows the profile of renewable energy.
A case study has been carried out to investigate the impact of turndown and ramp rates on cost for hydrogen storage. The example is a 6,500 t/d ammonia plant with a power input of 2.7 GW. It is operated in island mode with a battery as power back-up. The renewable energy production is a complementary mix of wind and photovoltaic for high stability of the power supply. The base case with which the other scenarios are compared is a plant with a possible turn-down-ratio of 20% of nominal plant capacity and a ramp rate of 60% per hour. The partial load ratio was varied at a constant ramp rate of 60%/h and, conversely, the ramp rate was varied at a constant partial load of 20%. The results for the necessary hydrogen storage size (100% is the hydrogen storage of the base case) are shown in Fig. 8.
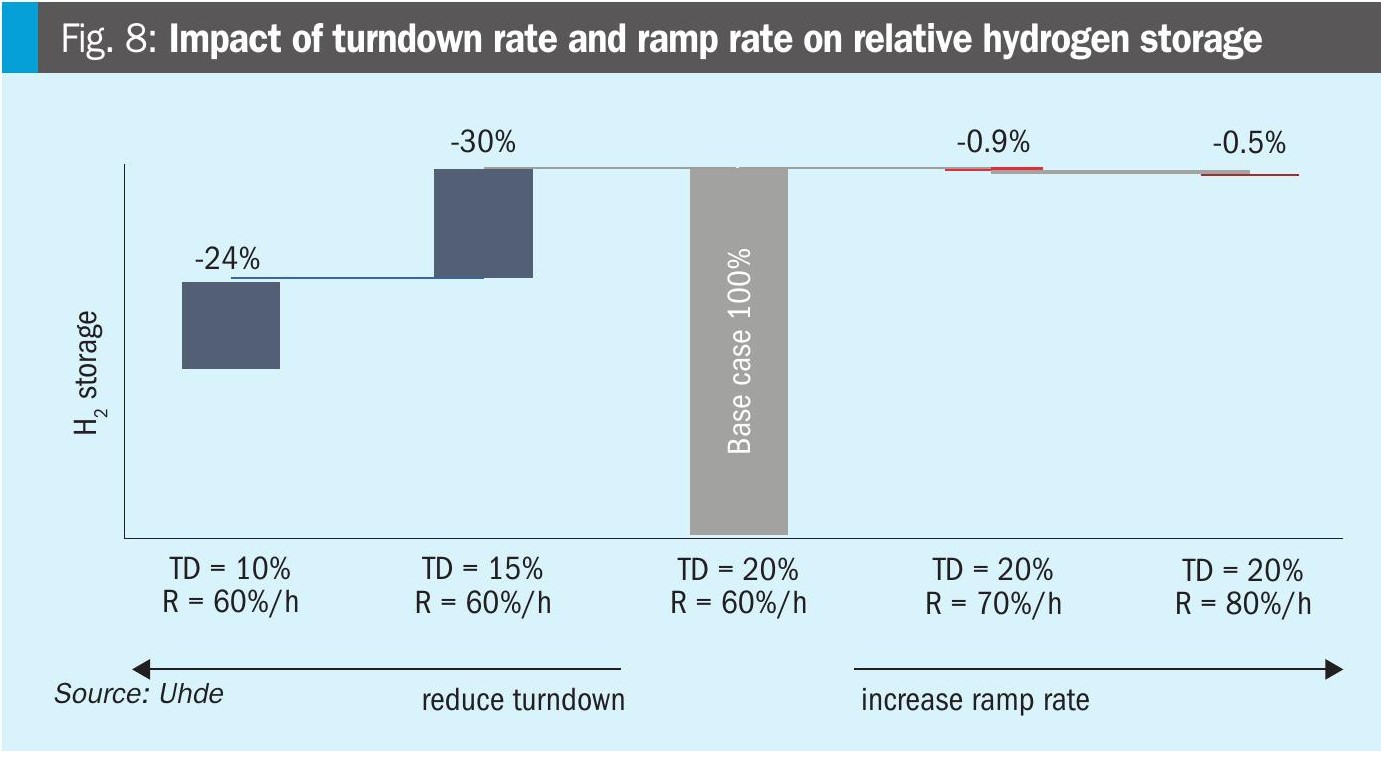
The diagram shows that the hydrogen storage can be reduced by 54% by lowering the turndown ratio of the ammonia plant to 10%. Increasing the ramp rate from 60 %/h to 80 %/h has only a minor effect on the hydrogen storage size; the storage is only decreased by 1.4%. The impact of the ramp rate is muted due to the inherent stability in power input, this means that the plant can faster ramp down or up the production capacity than the renewable power decreases or increases. The capital expenditures for the whole plant can be reduced by 5-10%. In this example the levelised cost of ammonia production can be lowered by 3.8% if the turndown ratio is lowered from 20 to 10%.
Summary
The innovate technology from thyssenkrupp Uhde enables a low turndown of 10% and ramp rates of 2%/min. Therefore, the plant has a high flexibility to respond to changes in hydrogen supply so that the hydrogen storage can be minimal. The energy consumption is around 10 MWh/t NH3 at a conversion of 98% hydrogen to ammonia product. This leads to a low total cost of ownership. The safe, reliable, and high operability of the plant enables an availability which is larger than 96%.
The green ammonia plant is standardised to a high degree based on pre-integrated standard concepts for core synthesis and critical support units. This can shorten the front end engineering design schedule by three months and the procurement is de-risked. Three different standard capacities, 300 / 600 / 1,200 t/d, have already been designed and capacities of 2,400 / 3,400 t/d are in progress.
The plant can be delivered in modules so that the construction cost can be derisked. Construction management services can be provided to assure the construction schedule.
Different contract models can be offered by thyssenkrupp Uhde with flexibility for project needs (joint venture, grant requirements):
• standard license with proprietary equipment;
• extended license with integration engineering;
• engineering and procurement/engineering, procurement, and fabrication;
• engineering, procurement, fabrication, and site services (construction management).