
Nitrogen+Syngas 363 Jan-Feb 2020
31 January 2020
Price trends
Price trends
MARKET INSIGHT
Alistair Wallace, Head of Fertilizer Research, Argus Media, assesses price trends and the market outlook for nitrogen.
NITROGEN
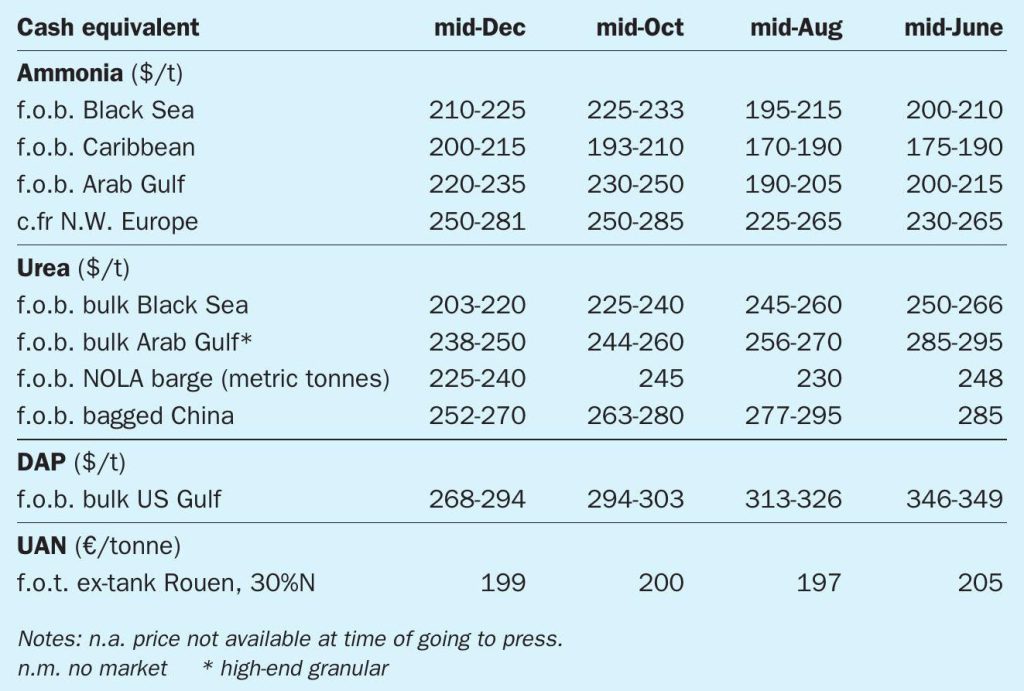
With 3Q 2019 seeing slowly rising ammonia prices, the fourth quarter of the year saw prices beginning to flatten out, and then some price declines due to oversupply and weak demand, before the end of 2019 saw the market rebalancing itself, with supply outages in Australia and Trinidad removing excess tonnage from the market. This reversed a two-month weakening price trend. The November contract price for Tampa was agreed up $5/t and Trinidad ammonia was priced at $220/t f.o.b., with Yuzhnyy trading $10-15/t higher. Southeast Asian sales were reported above $260/t f.o.b. for November. The December Tampa price fell $10/t and Trinidad spot fell by the same amount to $210/t f.o.b. The January Tampa price rolled over, as did the Baltic ammonia price.
A poor application season in the US has lowered near-term ammonia demand, while Moroccan import growth is expected to be disappointing, as OCP, the main producer, reduces its output of granulated MAP/DAP. Conversely, concerns over the rate of supply from North Africa has left Yuzhnyy suppliers largely sold out for January and February. Overall the market looks balanced, so any further supply interruptions, particularly in the Middle East, could see some sharp price movements upwards. C.fr values are likely to be bolstered by higher bunker costs and rising time charter rates.
The urea market was predominantly bearish during the fourth quarter, due mostly to a lack of demand. European buyers stayed out of the market, while the Brazilian safrinha corn planting season was delayed. Prices in Brazil eventually bottomed out at around $230/t c.fr, a $50/t fall since September. In Australia and Asia, dry weather and low crop prices also hindered demand. The one bright spot for producers was India, which held several significant tenders in 4Q, stabilising the market after three months of decline. This led to small price rises in China and Egypt. However, US prices continued to trade at a discount for much of the period. Supply for the full year 2019 was boosted by another 2 million tonnes of Chinese exports compared to 2018, while Black Sea urea shipments also rose by around 100,000 tonnes/month. This coincided with reduced import demand in Asia and zero demand growth elsewhere.
With all of the urea in place to cover awards in India, the Asian market is turning bearish. Traders are starting to sell short again. A price recovery in the US still looks vulnerable to incoming cargoes. The outlook is flat to bearish with low Asian demand likely to drag down Middle East urea prices. West of Suez is firmer, but likely to come under pressure too.

END OF MONTH SPOT PRICES
natural gas

ammonia

urea

diammonium phosphate