
Sulphur 386 Jan-Feb 2020
31 January 2020
Sulphuric acid plant health check
DIGITAL SERVICES
Sulphuric acid plant health check
Sulphuric acid plant operators juggle multiple issues trying to keep their plants running efficiently and reliably. With the revolutionary ClearView™ process health monitoring solution, as well the DynSOx™ software for simulating dynamic operation, Haldor Topsoe strives to bring digital services with real and tangible operational benefits to the sulphuric acid industry. P. Szafran and M. Granroth discuss how together these digital services can help acid plant operators meet their daily targets.
The current trend for increasing digitalisation of industrial plants results in the generation of more and more data that on its own can result in increased confusion rather than clarity. The key to taking advantage of digitalisation is to leverage the torrent of data and new computational capabilities to solve real operational issues.
For a bulk chemical market such as sulphuric acid, margins are thin, and plant operators are under constant pressure to improve operation to stay profitable. Ensuring optimal operation means minimising downtime, maximising throughput and avoiding costly equipment damage. Throughout the world, maintaining emission levels below stipulated limits is one important consideration. While emission control may have been mainly related to steady state operation in the past, dynamic conditions, such as start-up, are increasingly attracting the attention of authorities.
Topsoe has been working with digitalisation in different forms in a number of areas. For sulphuric acid, the two latest developments are ClearView™ and DynSOx™ .
The driver for these developments is a need to address common challenges faced by sulphuric acid producers; these include poor data quality, wasted time in compiling data rather than analysing it, and a lack of knowledge, especially with high rates of staff turnover. These challenges are experienced on a day-to-day basis, and result in lower throughput, unplanned downtime, avoidable maintenance costs or increased emissions.
Reliability through ClearView™
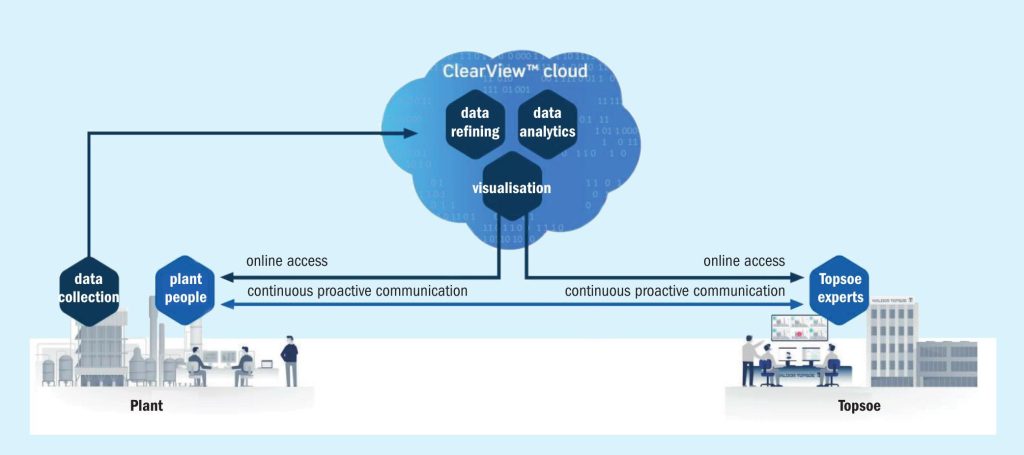
Topsoe launched its connected services, ClearView™, for ammonia, and hydrogen plants in March 2019, in cooperation with Honeywell as a strategic partner. The same concept (see Fig. 1) is now being introduced for the Wet gas Sulphuric Acid (WSA) technology.

ClearView™ WSA is a connected solution based on streaming data to an Industrial Internet of Things (IIoT) platform in which rigorous in-house models simulate process data and compare plant parameters to their optimal and healthy values to provide early warnings of process-related problems. ClearView™ WSA also monitors plant start-up and shutdown, and predicts hydraulic and catalytic performance of the unit in order to provide plants with a proactive approach to shutdowns and catalyst screening, before unit capacity is affected.
Online dashboards are designed to deliver up-to-date insights directly to the relevant persons and cater to various roles in the plant, including the overall KPI focus of the CEO and plant manager, at a glance alerts for the daily shift engineer and detailed optimisation screens to be used by the technical department.
The goal of ClearView™ WSA is simple – to detect and mitigate abnormal operation to prevent any surprises in the form of unplanned downtime, and to offer tools and recommendations to mitigate risks, and resolve problems on a planned basis, ensuring world-class availability and reliability.
Handling dynamic conditions with DynSOx™
Although normal steady state operation of sulphuric acid plants can be quite intricate, modelling this operation has taken precedence over transient conditions. Unsteady state operation of plants has long been a black box for designers and operators alike. In particular the behaviour of the catalyst within the SO2 converter during these conditions was not well understood. To address this, Topsoe started to investigate the different processes taking place in and around the catalyst as gas conditions, temperature or pressure changes. Based on the results of these studies, a model was developed that is able to predict the behaviour of the converter during dynamic conditions1 . This model together with the knowledge of the technical service team is offered to acid plant operators under the name DynSOx™ .
Modelling of the complete catalytic system in an SO2 converter is a complicated task with many unknown parameters due to the number of potential reactions and the different oxidation states of vanadium in the catalytic cycle2 . Based on an assumed fundamental mechanism and catalytic cycle, a consistent model comprising temperature-dependent solubilities and reaction rate constants may be set up for dynamic conditions. The challenge in terms of model applicability is that a considerable number of parameters cannot be determined independently and reliably, and as a consequence lose their original physical meaning.
A more practical, semi-empirical model with fewer parameters was developed. The transient SO2 converter model contains accumulation terms for heat and SO3 and is capable of predicting the observed dynamic behaviour of pilot- and full-scale plants1 . Accumulation of O2 and SO2 is neglected due to their low solubility in the catalyst melt. The fluxes of SO2 , O2 , and SO3 to the catalyst melt are calculated from additive contributions from steady-state catalysis, and unsteady absorption or desorption.
With the capability of predicting the behaviour during transient conditions, unsteady state operation such as startup no longer needs to be a black box for acid plant operators. Catalyst loading and operational parameters can now be optimised to reduce emission peaks, increase potential hot stand-by time and give peace of mind through better understanding of process behaviour and risk. This is an excellent complement to ClearView™, and will help acid plant operators meet their targets and minimise downtime.
ClearView™
Dealing with fluctuating conditions
Fluctuations in chemical unit operations are a given in any process industry, but this is especially the case in one dealing with processing sulphur-containing off gases, as is the case with many WSA units. Even operators of sulphur-burning or spent acid regenerating WSA units take advantage of their installed capacity by supplementing sulphuric acid production with off gases from upstream operations, while recovering energy in the form of steam.
Fluctuations in both the volume and the sulphur concentration of off gases are outside of the plant’s control, and it is common for the sulphuric acid production rate to vary as a result. Units are designed to handle a peak feed flow and sulphur concentration continuously, so process fluctuations should not matter as long as they take place below these maximum design values. However, few would suggest that feed flow and concentration, or, by proxy, sulphuric acid production rate, are the only parameters required to determine a unit’s operational health. An adequate assessment of process performance involves assessing the catalytic, thermal and hydraulic capabilities, even if the unit is running below its design load.
To make meaningful and actionable conclusions regarding the performance of any piece of equipment, or the process as a whole, one requires a consistent mass and energy balance. The starting point is to identify a period of time when the unit is steady enough to perform a mass and energy balance – attempting to do so for too short a period of time will introduce error due to process fluctuations, while taking a period that is too long risks compressing periods and subjecting them to excessive smoothing, removing necessary details. The common approach is to look at process trends and guess at a representative period of time by qualitatively judging process steadiness from a parameter’s graphical appearance.
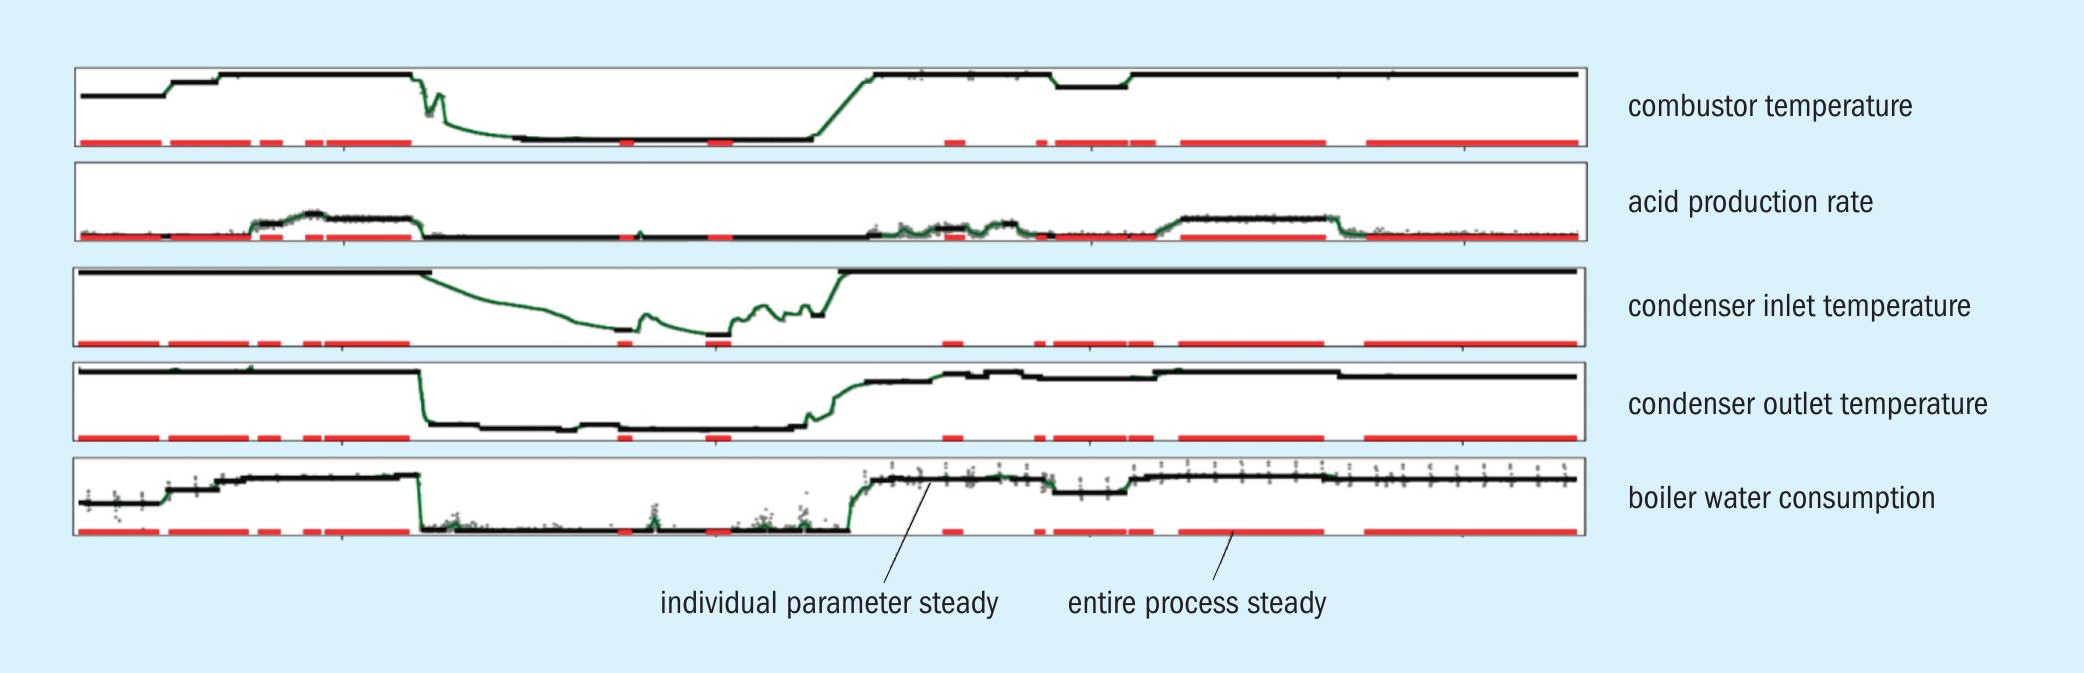
Using mathematical algorithms to analyse selected process data for stability, ClearView™ removes the uncertainty and irreproducibility caused by this guesswork. This process is referred to as steady state detection. Individual process parameters are checked for steadiness, and when all the selected parameters are steady the entire process is deemed to be in steady state, thereby allowing one to confidently proceed to the next step of obtaining a consistent mass and energy balance for a period of operation. Fig. 2 depicts steady state detection applied to four weeks of operating data from a WSA unit, on either side of a stoppage. Although not all the relevant parameters are shown here, the principal being illustrated is that each individual parameter is checked for steadiness (line across the data trend), and when all parameters are steady simultaneously, complete process steady state is shown (line at the base of each trend). In such a way, an entire month of operation is broken into well-defined periods, each with its own associated mass and energy balance.
The term “steady” is itself not a rigid term – steady means stable relative to each parameter’s own range and standard deviation, and various inputs control how strict the criteria are that consider a parameter to be steady or not. A quick-responding, easily-controlled process variable such as boiler feed water may have a lower fluctuation than a parameter such as a combustor chamber temperature, but the goal is to find a period of time when each parameter’s fluctuations is within their own acceptable range, allowing an average value for a given period of time to be representative of the entire period of operation. Take for example the boiler water consumption at the bottom Fig. 2; regular spikes can be seen in the process data that represent a sudden increase in boiler feed water flow when the operators perform routine boiler blowdown. A simple mathematical (Gaussian) filter is applied to the data and steady state detection is applied to the filtered data, meaning these spikes do not unnecessarily break the steady state of the parameter in question.
Apart from providing a systematic way of knowing where to distinguish between periods of operation, having access to steady state detection has monitoring benefits for plant operators and engineers. If a process has been steady for the duration of an entire shift, or day, or longer, plant operators and engineers will be familiar with the state of the unit on a day-to-day basis and do not need to spend time looking through trends on a DCS historian. There is a decrease in the amount of time spent on process monitoring that will not yield any useful results. On the other hand, if the process steady state was broken, one is able to see when it broke, as well as which parameter(s) caused it to break, and which ones were able to reject disturbances. This provides an immediate starting point for all process monitoring and troubleshooting. Over the long term, process stability can be improved by analysing whether fluctuations in parameters that break steady state can be reduced through improved controller tuning or modifications to procedures, or whether more sophisticated interventions are required. This will lead to improved overall unit stability.
Resolving inconsistent mass and energy balances
Once a period of time has been selected, a mass and energy balance can be performed. Details of process flows, temperatures, and compositions can be combined with the unit’s pressure profile to allow one to understand, among other things, the thermal performance of burners and heat exchangers, the hydraulic performance of pumps and blowers, and catalyst performance.
It should come as no surprise that mass and energy balances rarely close, with errors arising from a multitude of sources. Instrument measurement error manifests due to a number of causes, including inherent instrument error, incorrect calibration or compensation, fouling, measurement location, poor process gas mixing (in the case of temperature measurement), and inaccurate laboratory or analyser measurements.
The most basic mass and energy balance tool in a plant that produces sulphuric acid is to compare the flow and SO2 concentration (if available) of the stream into the SO2 conversion reactor, with the produced rate of sulphuric acid. One then compares this to the temperature increase across the catalyst to validate the SO2 concentration in the gas. If the mass and energy balance close, then one is able to take just the feed flow and concentration, and use the SO2 conversion rate of the reactor to calculate the mass of acid that will be produced, and predict the temperature rise across the catalyst. A failure to predict the product flow meter reading or the reactor outlet temperature does not say anything about which instrument is giving a false reading – any of the instruments concerned could be the culprit for inaccuracies. In fact, it is more accurate to say that every instrument is the culprit, although to various extents. This is something that is already consciously performed when the one doing the calculations looks at a result and concludes that the answer is “close enough”. It is known that an error of certain magnitude should be expected, and the error is not formally attributed to any instrument individually, unless it is known that a particular instrument is faulty or unreliable.
Data reconciliation is the process of “smoothing out” the error by attributing error to various instruments until the mass and energy balances close. The degree to which a process parameter is allowed to deviate from an instrument reading is determined by the standard deviation that is assigned to the instrument. This assumes that error in a reading will be normally distributed around the true value. In this way, a properly-positioned, calibrated and maintained thermocouple in the SO2 converter can reasonably be expected to be within 5°C of the true value, while more margin is given to a thermocouple in a combustor, say. Calculating a combustion chamber temperature to within 50°C of the reading (typically in the region of 1,000°C) would be considered accurate enough to have arrived at a consistent dataset. While standard deviations are mathematical in their backgrounds, in a data reconciliation application they are assigned based on experience in dealing with enough process data. The cumulative differences between smoothed (reconciled) and measured values is then calculated by a sum-ofsquares-type expression (SSQ), as follows: where i represents each instrument considered in the reconciliation, and σ is the standard deviation for that instrument. The consistent data set that is the best representation of reality is the dataset for which the sum of squares is minimised.
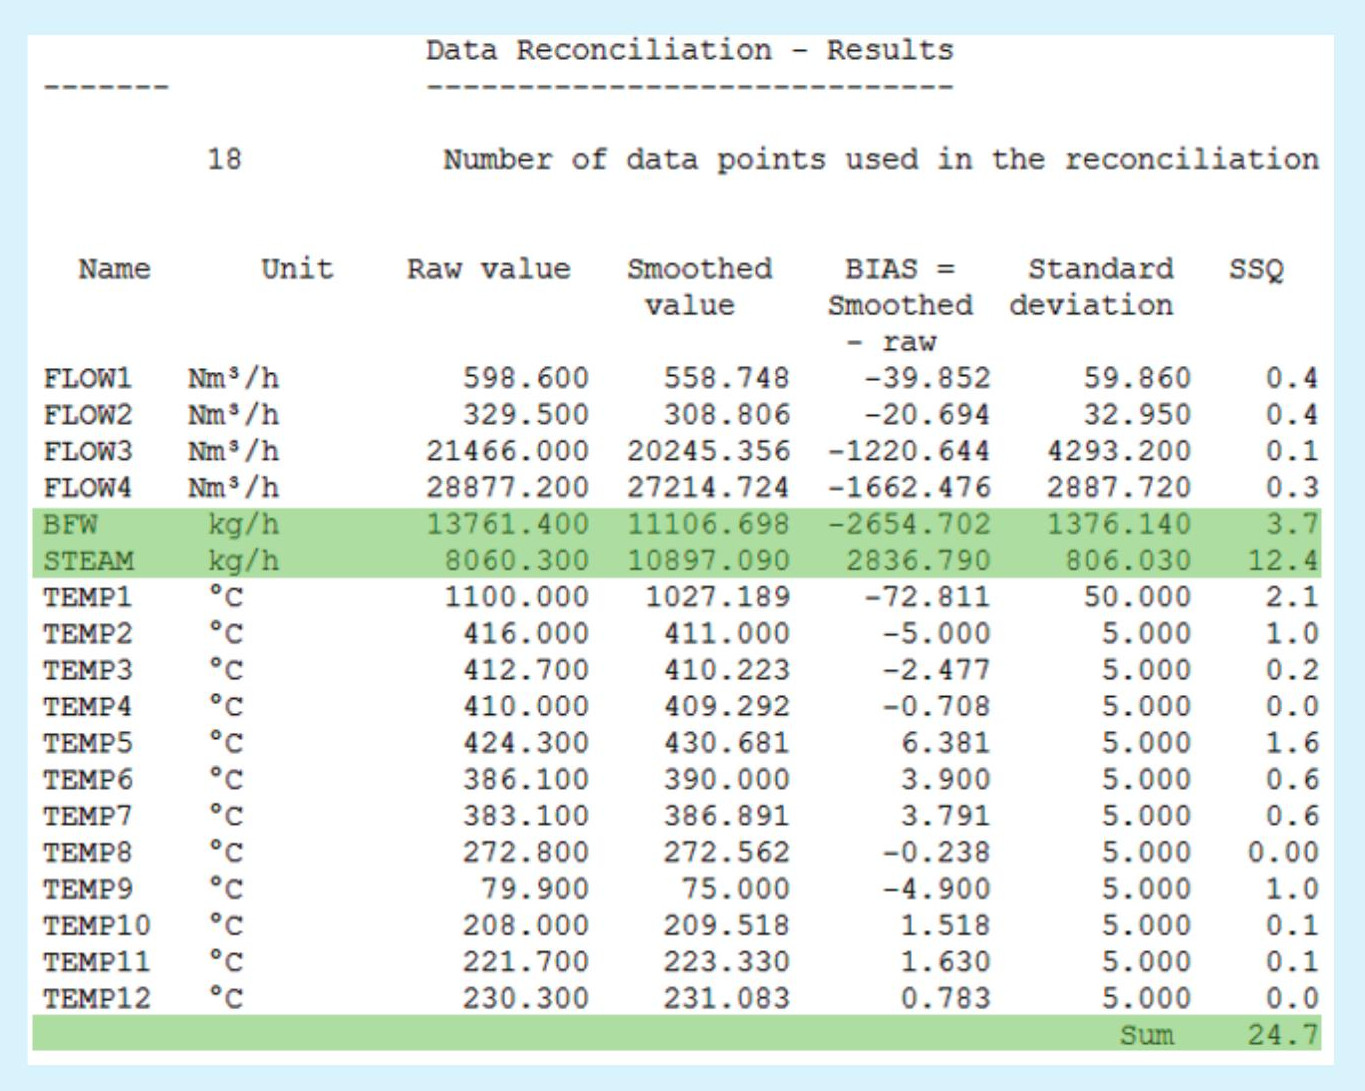
Data reconciliation requires a model that explains the relationship between process variables. ClearView™ uses the full process model that is used to design WSA units. Each plant is individually assessed to establish the parameter selection with the strongest links to provide a meaningful result. Fig. 3 shows an example of how the results of such a reconciliation look. The “raw values” are average instrument readings for a steady state period, and correspond to the “measured” values in Eq. 1. The mass and energy balance of the unit does not close with these values. The “smoothed values” on the other hand represent a closed mass an energy balance that is consistent with the model of the unit, denoted by “reconciled” in Eq. 1. The bigger the difference between a smoothed value and a measured value, the larger its contribution to the SSQ error. The reconciliation revealed that there is a good agreement between measured and modelled parameters across the unit, except for the boiler feed water (BFW) and steam production. These are the most significant contributors to the SSQ.
With this information a plant operator is then given direction on which instrumentation should be checked, calibrated, or replaced. This allows operators to move towards a more consistent dataset on a continuous basis, to the point where insignificant adjustments are required to reconcile the data. The reinforced confidence that one then has in one’s instrumentation means that one is able to confidently assess process performance, and optimise operation. Accurate readings also result in safer unit operation.
Going beyond DCS alarms
It is a common question in operational environments when equipment doesn’t behave as expected and a process value is abnormal – “what is the value normally?”.
If one has rigorous models to simulate equipment, then one can compare the expected and the measured process parameters continuously. This is now possible with a reconciled dataset – a single error would have made modelling difficult. Ideally, discrepancies should be detected, before alarms on the DCS system are activated. However, this requires that a rigorous model is developed – this could be a hydraulic model to predict the pressure in a line, or a heat exchanger model to predict the outlet temperature of a heat exchanger. However, these are not always available. Also, a plant operator would not undertake to develop a rigorous model explaining every parameter in a unit. In these instances, a comparison of current and past behaviour for similar process conditions is valid and extremely useful.
To elaborate on the limitations of the DCS alarm system – there are many design margins added to the overall unit design, and then again to each individual piece of equipment. Take for example a gas treatment plant that is design to continuously comply to SO2 emissions at a peak gas flow and a peak gas sulphur content. In defining these peak conditions, plant owners will be conservative and add margins to the design basis of the unit to ensure that there are no emissions compliance concerns during regular operation. An individual heat exchanger, such as a cooler between catalyst beds, will also have fouling factors and excess area margins in its design. The DCS alarm for high temperature out of this cooler will be selected based on the material properties of the cooler and reactor, as well as the correct operating temperature of the catalyst bed downstream of the cooler. During regular operation, away from the peak gas flow and sulphur concentration, the excess area is more than sufficient to meet the temperature set point out of the cooler. Even in the event that there may be heavy fouling in the cooler, the excess area masks this; indeed, this is the entire point of including the design margin. In this case, consider the extremely fouled state of the cooler necessary to trigger a DCS alarm on a piece of equipment with all this excess capacity. The DCS alarm does not serve as a pro-active tool for identifying problems as it requires a large deviation in equipment behaviour, especially when the unit is running away from design capacity.
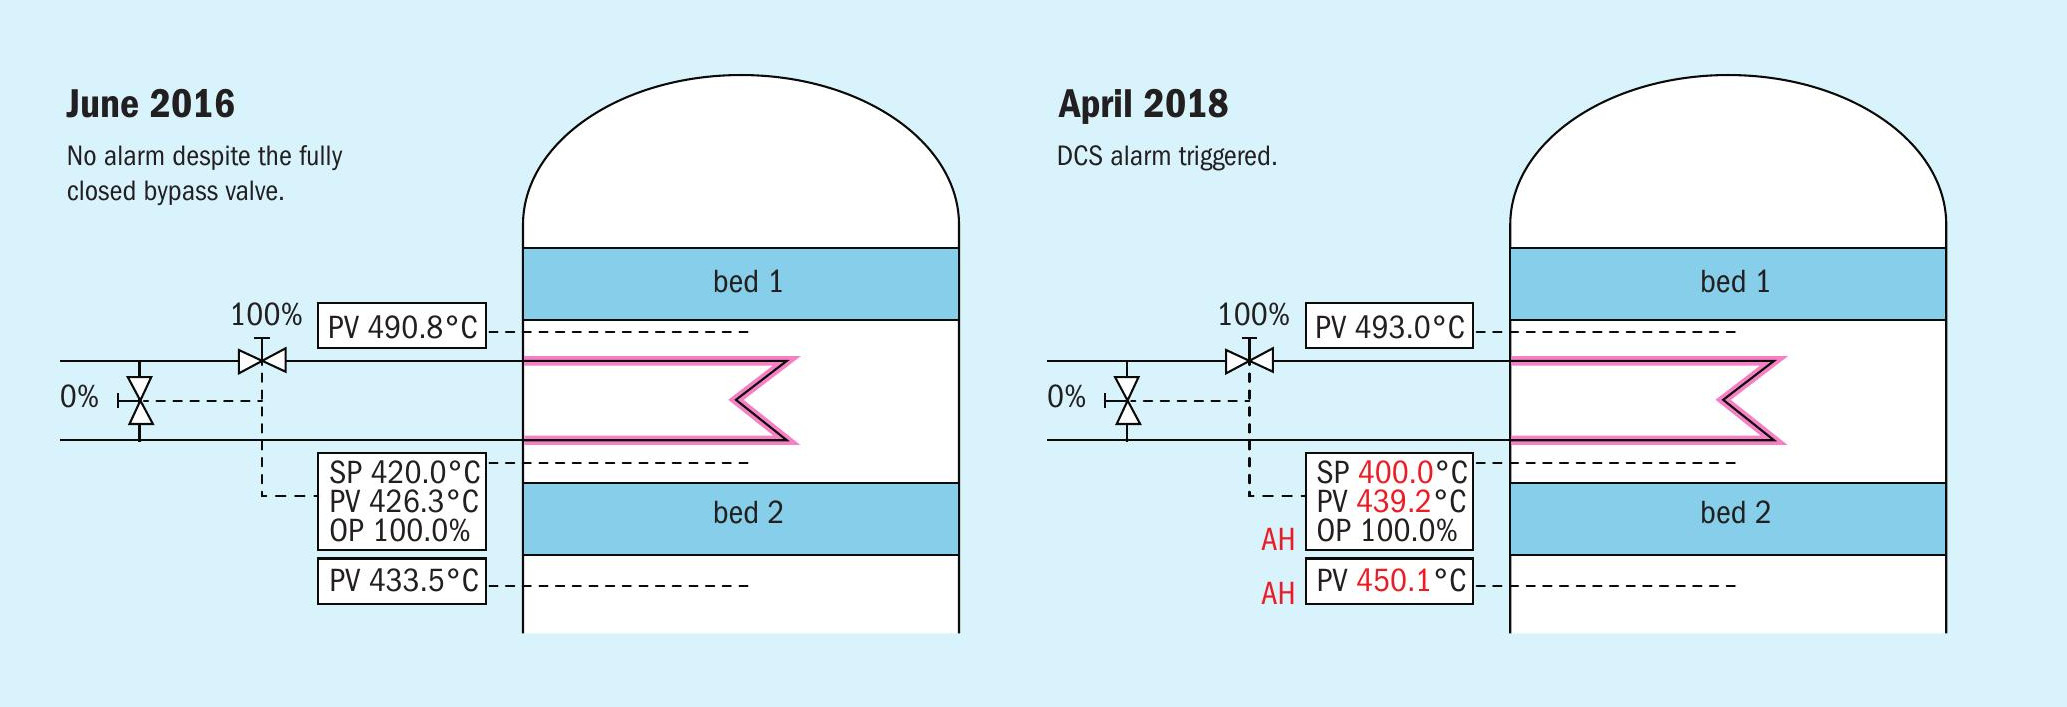
An example of this is shown in Fig. 4, which depicts the SO2 converter on a combined sulphur-burning/off gas-treating WSA unit running almost identical sulphuric acid production – about 90% of the design rate – almost two years apart. The interbed cooler is unable to cool the gas out of the first bed to the set point of 420°C into the next catalyst bed. Already in the first instance (June 2016) one can see that the interbed cooler bypass valve is fully closed to allow maximum steam flow into the cooler to try reduce the temperature of the gas, unsuccessfully. Despite this problem, no DCS alarm is activated to indicate a problem with the cooler. The representation of the same DCS screen during a period of similar production (April 2018), showed that the temperature into the second bed had climbed over time with deteriorating cooler performance (from 426°C to 439°C for very similar temperatures into the exchanger), and the DCS alarms for high temperatures in and out of the next catalyst bed had eventually activated. One can see that the operator had tried to reduce the set point to the downstream bed to 400°C, without any way of achieving this given the cooler had been operating with a fully-closed bypass for at least 22 months.
This situation resulted in higher SO2 emissions (due to lower conversion in the second bed) and reduced energy efficiency of the unit in the form of lost steam production. The highly-valued steam production had to be made up by burning fuel in a steam generator to meet steam demands in the complex. The unit was also running at a higher downstream temperature, putting the plant at risk of equipment damage due to high temperatures. A plant pressure survey by Topsoe field engineers during operation revealed a high pressure drop around this cooler, an unusual area for hydraulic restriction, and an inspection and cleaning of the interbed cooler was recommended. The pressure build-up over the cooler also meant a reduction in the volume of off gas that was treated in the unit; the hydraulic restriction had mistakenly been attributed to another piece of equipment with a faulty pressure measurement.
In the abovementioned example, the exchanger could have easily been simulated and problems detected before the valve opened fully in June 2016.
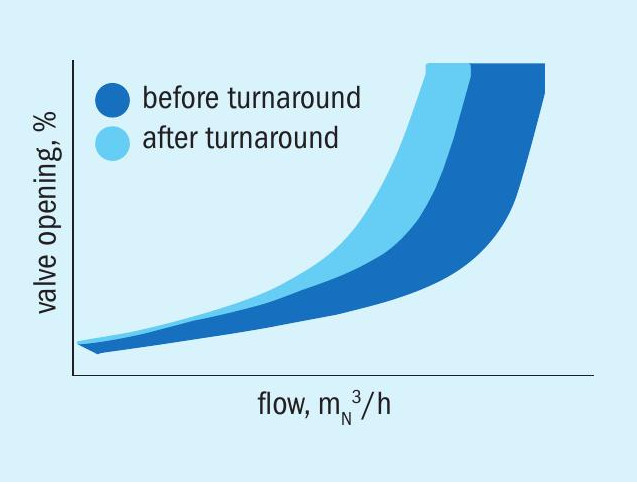
An example of a situation in which a rigorous model is less simple to develop, but a unit’s own historical operation was used as a stand-in, is provided in Fig. 5. In this situation, another WSA unit was taken offline for a statutory inspection. The unit historically had a bottleneck in the amount of primary air that could be fed to its combustor, and the processing capacity was found to be even lower after the turnaround.
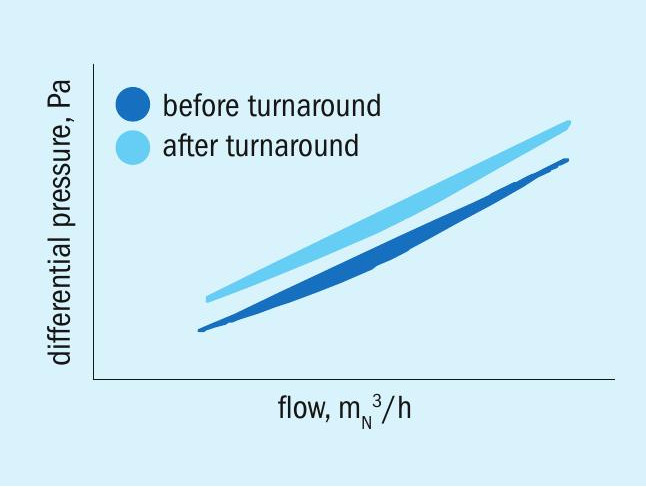
Apart from the valve opening to 100% sooner, and capacity being reduced, DCS alarms did not shed light on the cause of the post turnaround capacity reduction. The burner pressure drop (seen in Fig. 6) was not a parameter that was monitored very closely, and was not all that different, speaking in absolute value terms, to pre-turnaround values. Only a graphical comparison against its pre-turnaround behaviour revealed that activities during the turnaround had left a restriction in the burner.
The unit operated at reduced capacity for a month before this problem was detected and it was decided to shut it down again to resolve the problem and restore capacity.
Continuous performance assessment through ClearView™ builds up a database of expected values where rigorous models are available, and historical parameters where they are not. These baseline values can then be compared for similar operational periods obtained from data reconciliation, and their behaviour over time is tracked, issuing a warning sooner than possible with DCS alarms, as evidenced by the two examples provided. Earlier detection means earlier action, and lower risk of unplanned downtime.
Benefit to new unit operation
The commissioning of a unit represents a critical period where months, if not years, of planning, engineering, and construction activities come together to achieve the desired outcome of successful start-up of a unit. It seems obvious to say that this is an important period, however, the reasons are not as obvious as one may think. Apart from the successful execution of the project, this period is when:
- the design basis and design assumptions of the unit can be verified;
- the detailed standard operating procedures and checklists are adapted to real-life conditions to enable operation of the unit;
- operating habits are formed;
- a transition between the project execution team and the operational team takes place, often with the loss of knowledge that has been accumulated within the project execution team.
The culmination of weeks of commissioning is typically the performance/guarantee test run, which takes place after the unit has had time to stabilise. This test run is intended to prove that the unit is able to perform at the desired capacity, produce the guaranteed product quality, and comply with guaranteed emissions. Thereafter there is acceptance of the unit by the plant owner/operator, and the responsibilities of the Engineering, Procurement, and Construction (EPC) contractor and technology licensor are for the most part complete.
In the event that there has been a shortfall in any of the points listed above, operational challenges may only develop after the unit has spent some time in operation (a reminder of the two years a plant spent with a cooler valve fully open, in the example given earlier). Should a unit experience a capacity bottleneck, unplanned downtime, or equipment failure, a plant owner needs to understand whether this was a once-off incident, whether the root-cause was outside of the owner’s control, and whether there is a deficiency in design or operation. In troubleshooting such a situation, one typically only looks at the periods of time leading up to an incident, as looking all the way back to the plant’s commissioning would involve processing too much data.
ClearView™ WSA now enables Topsoe, to facilitate a smooth transition between commissioning and commercial operation. ClearView™ WSA combines the technology-specific knowledge with experience gained from the ongoing support offered to Topsoe clients. It also means that the plant has a complete database of its operation that surpasses the DCS historian, as all reconciliation calculations are also stored, and projections made by calculations can then easily be verified.
ClearView™ works on a fault-model system in which alerts are triggered in the event that abnormal or sub-optimal operation is detected. The alert is linked to an action panel that describes the deviation, shows trends relating to it, explains the effect that this deviation may have if it is allowed to continue or increase, and also suggests mitigating actions to be taken by operators. In this way, it also facilitates training and knowledge retention, guarding against problems such as high rates of staff turnover.
ClearView™ presents all data, calculations, and predictions in easy-to-understand dashboards that are available from day one of a new unit’s operation, meaning that monitoring tools do not have to be developed on a trial-and-error basis. This also means that, with all the analysis being done automatically, there is more time for customers to be engaged in constructive discussion with Topsoe, rather than spending time compiling data, and being caught up in email or telephonic back-and-forth, as is all too common.
Using DynSOx™ to complement ClearView™
For wet gas sulphuric acid plants, ensuring that there is no risk of condensation is a crucial part of avoiding unwanted equipment damage and downtime. As a consequence, operating conditions near the dewpoint of sulphuric acid is a key consideration during both the design and operation of these plants. Since the acid dewpoint is a result of several different parameters, intricate analysis and knowhow is necessary to determine whether new operating conditions are safe or not. During steady state, such analysis and tools have long been an important consideration for technical service team at Topsoe, and it is also included in the ClearView™ solution. So far, transient conditions have been much harder to analyse, since it is not only the sulphur content in the feed that plays a role, but the conversion, absorption and desorption capabilities of the SO2 -oxidation catalyst as well. Plants have of course been able to handle these operating conditions in the past as well, however, it has required the use of large safety margins to avoid potentially unsafe operation. With the addition of Dyn-SOx™ , the black box that is dynamic conditions is now more transparent, offering the possibility to tailor procedures and operation to achieve both more optimised, and safer, operation.
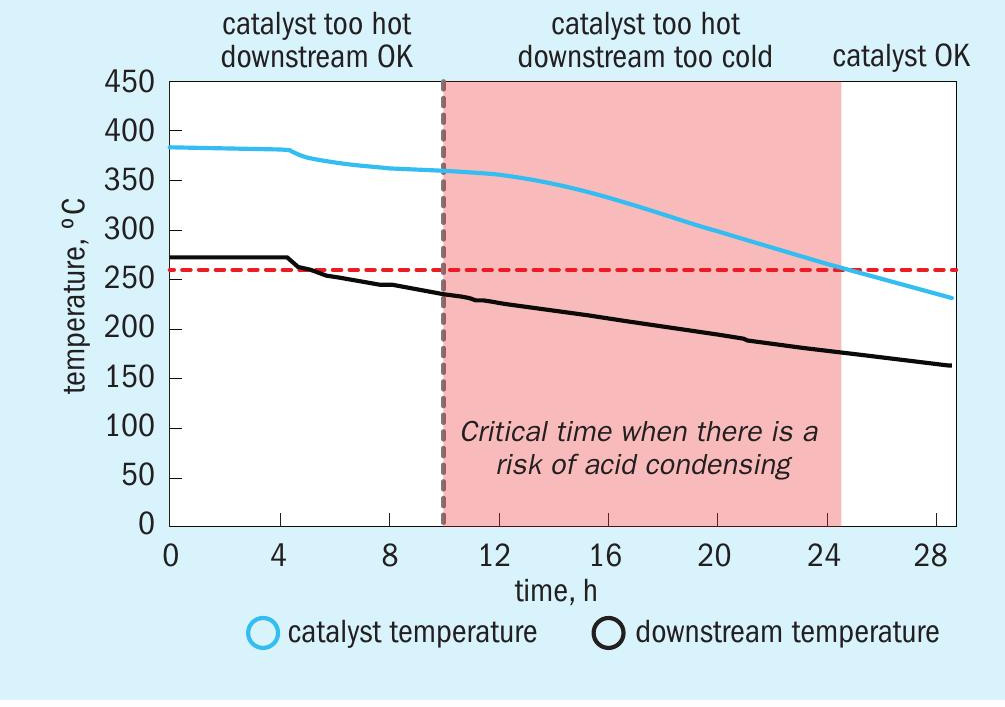
To illustrate how DynSOx™ can be used in combination with ClearView™ to address the specific concern of acid condensation, we look at an example from a WSA plant where the unit tripped due to an upstream upset and was purged with hot air. Due to the desorption of SO3 from the catalyst, sulphuric acid can form downstream of the catalyst beds hours after the process gas fed to the plant has been replaced with air. Combined with decreasing temperature during the purge, the presence of sulphuric acid is potentially problematic, and where this is not normally a concern, in this particular case there was a fear that the allowable operating window was being exceeded. Typically, a guideline is provided to keep a downstream temperature above a threshold value until the catalyst is cooled to 260°C. The potential concern period is illustrated with the plot in Fig. 7, where the critical period when the catalyst is still warm enough to desorb SO3 , while the downstream temperature of the plant is falling, is highlighted.
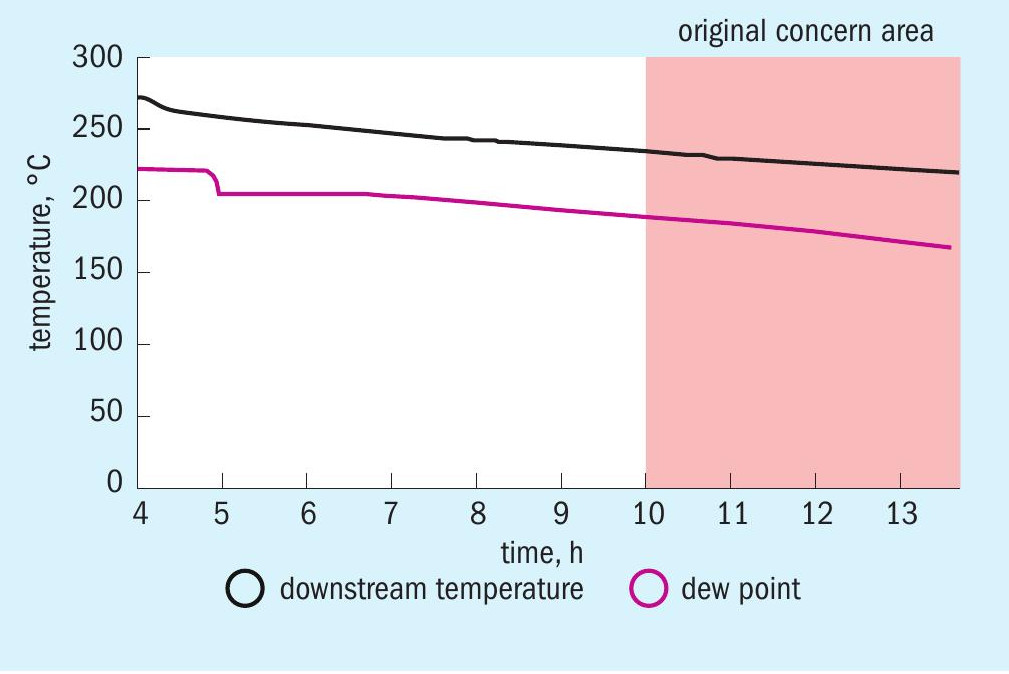
Previously there would have been no way of knowing if acid condensation was a risk without waiting to conduct a physical inspection during the next turnaround, but with DynSOx™ , there is now a faster and much more informative way. The recorded outlet temperatures and simulated acid dewpoint are presented in Fig. 8.
The DynSOx™ simulation, when compared to the lowest temperature in the plant, shows that the actual temperature was consistently well above the sulphuric acid dewpoint for the entire purge following the plant trip. It was therefore concluded that there was never a risk that sulphuric acid would condense on the equipment downstream of the SO2 converter during these conditions. Not only does these results give the plant operator the reassurance that the plant was controlled correctly during the incident, but the operator also knows that in future that the plant can be shut down in a similar fashion without a risk of corrosion.
The validity of these results was confirmed at the next turnaround when Topsoe service engineers performed a plant inspection and no corrosion was found.
While DynSOx™ is not fully integrated with ClearView™ at this early stage of development, the combination of the two offers important synergies. On the one hand, technical service engineers at Topsoe can use trustworthy reconciled data from ClearView™ as a basis for Dyn-SOx™ studies of complex dynamic situations; on the other, results and knowledge from the DynSOx™ studies can then be fed back to ClearView™ , resulting in safer and more efficient operation and procedures.
DynSOx™ on its own
Although DynSOx™ can be used very successfully together with ClearView™ , it can also be used on its own to simulate dynamic conditions in both conventional dry gas sulphuric acid plants and WSA plants. To illustrate how DynSOx™ can be applied on it is own, an industrial example of how it is used at one acid plant to help address start-up emissions is given.
A large-sized sulphur burning sulphuric acid plant was struggling with its emissions during start-up. The operator considered installing caesium catalyst to try to resolve the situation, but resources were limited, so a large investment in caesium catalyst had to be justified by some evidence of the effect of the catalyst change. To better understand the complex behaviour during start-up, data from one start-up was studied using DynSOx™ .
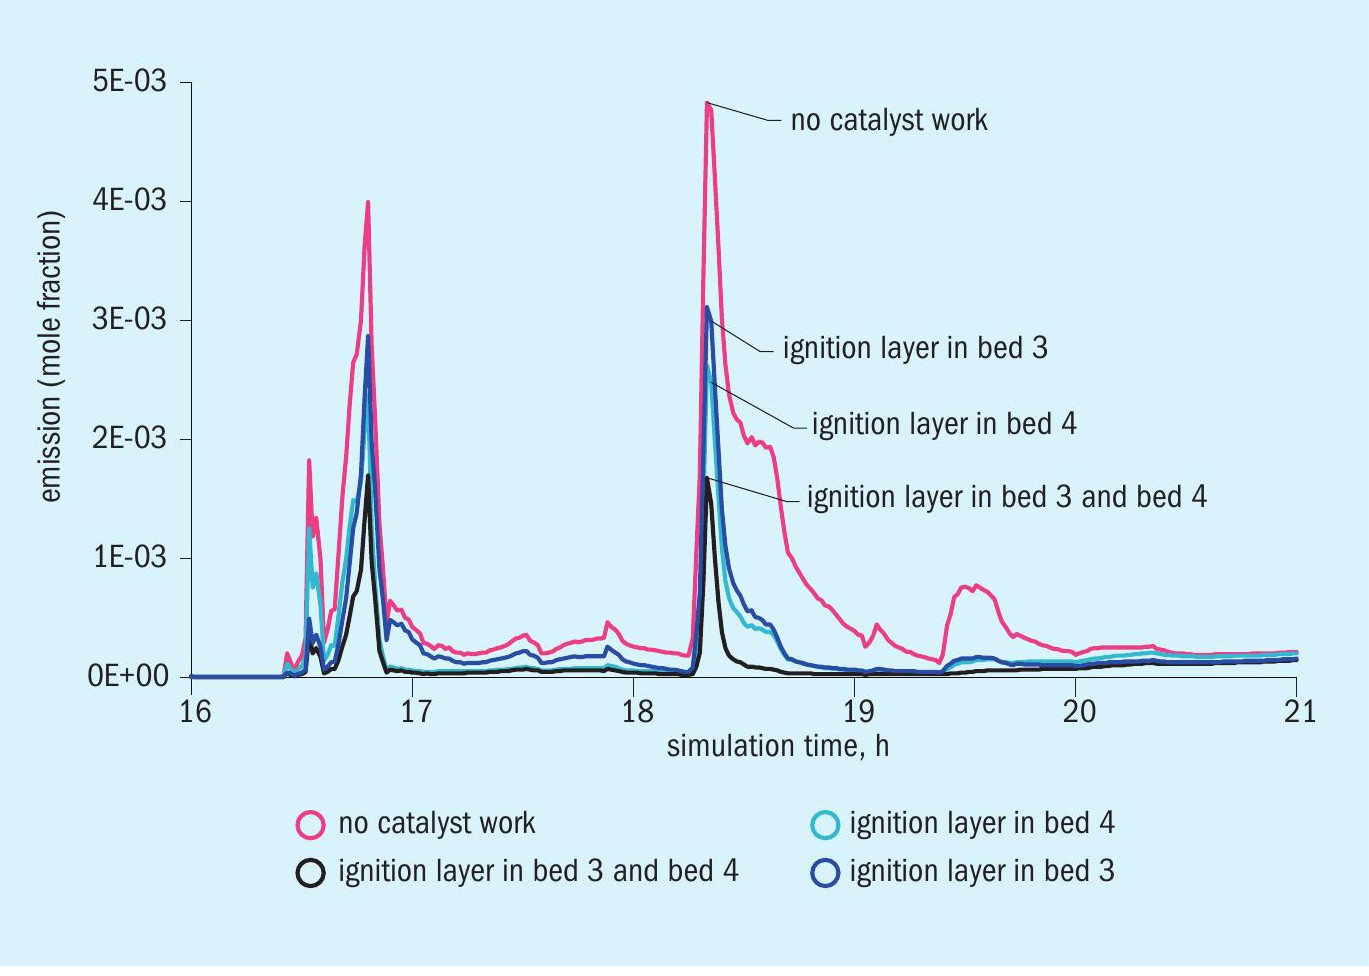
In addition to the current state, where no caesium promoted catalyst was being used, the effect of ignition layers with caesium promoted catalyst in bed 3, bed 4 or a combination of beds 3 and 4 was investigated.
From Fig. 9 it is clear that any ignition layer in either bed 3 or bed 4 would reduce the start-up emission peak significantly, by at least 35% compared to the current catalyst loading. The simulation results also indicate that for this particular plant and set of conditions, the effect of an ignition layer in beds 3 and 4 is similar, but with it being slightly more effective to use the caesium catalyst in bed 4. Finally, the study showed that the improvement of using ignition layers in both beds 3 and 4 was significant over just using a caesium ignition layer in one of the beds. The total emission reduction compared to the current situation would be 70%, while the improvement compared to only having an ignition layer in bed 4 would be 40%
For the operator in this example the improvement in start-up performance offered by a caesium ignition layer in bed 4 was sufficient. Furthermore, since the steady state conversion was acceptable, replacing only 1/3 of the bed was all that was needed. By applying DynSOx™ , the operator could be confident that their start-up issue could be solved by using caesium catalyst. Not only could it be solved, but by using DynSOx™ it could also be done while keeping catalyst replacement at a minimum.
Conclusion
While the sheer amount of data available to an operator of a modern sulphuric acid plant can be daunting, the data, computational capabilities and tools offered by the latest digitalisation trends can also offer significant advantages. ClearView™ and DynSOx™ are two examples of the advantages that the latest technology can bring to acid plant operators.
References