Fertilizer International 494 Jan-Feb 2020

31 January 2020
The year ahead: rebounding from contraction?
2020 MARKET OUTLOOK
The year ahead: rebounding from contraction?
We look ahead at fertilizer industry prospects for the next 12 months, including supply and demand growth, and explore the key agricultural, macroeconomic and geopolitical drivers likely to shape the market during 2020.
Medium-term prospects for the world fertilizer market remain limited. Insipid demand growth of around one percent year-on-year is expected over the next five years. This partly reflects the steady decline in the growth rate of world agriculture. Improvements in nutrient use efficiency and more nutrient recycling are also expected to depress primary fertilizer demand1 .
Changes within individual countries are also shaping the overall market. Declining fertilizer consumption in China, in particular, is acting as a downward drag on the world fertilizer market. The continued reliance on the subsidy-dependent Indian market, meanwhile, looks increasingly unsustainable over the longer term, being contingent on continuing government policy support.
North America’s long shadow
Looking back at last year, unfavourable North American market conditions had a particularly damaging effect. Indeed, the unprecedented crash in US consumption in spring 2019 (see box) actually tipped world fertilizer demand into reverse in 2018/191 . This contraction was compounded by a number of other negative factors, including:
- Low international prices for most crops
- Unfavourable weather in eastern Australia
- Currency depreciations in Turkey and Pakistan, both key fertilizer-importing countries
- China-US and Russia-Ukraine trade tensions
- Re-imposition of sanctions against Iran.
Global growth slows
Worryingly, the International Monetary Fund (IMF) has downgraded its global growth forecast for 2019 to just three percent – its slowest pace since the global financial crisis of a decade ago – describing this as a “synchronized slowdown”.
“This is a serious climb down from 3.8 percent in 2017, when the world was in a synchronized upswing,” commented Gita Gopinath the IMF’s chief economist.
She blamed subdued global growth on:
- Rising trade barriers
- Elevated uncertainty surrounding trade and geopolitics
- Idiosyncratic factors causing macroeconomic strain in emerging markets
- Structural factors in the advanced economies – such as low productivity growth and ageing demographics.
Global growth looks set to improve modestly to 3.4 percent in 2020, according to the IMF, albeit a downward revision of 0.2 percent from the fund’s April projection. However, it describes this recovery as “precarious”and narrow rather than broad-based.
For the advanced economies, growth is actually projected to slow to 1.7 percent in 2019 and 2020. Growth rates in emerging market and developing economies, in contrast, are projected to pick-up from 3.9 percent in 2019 to 4.6 percent in 2020. Turkey, Argentina, and Iran are all expected to recover from shallow recessions. After slowing in 2019, growth is also expected to accelerate in Brazil, Mexico, India, Russia, and Saudi Arabia this year.
Complex demand drivers
Fertilizer demand is influenced by a range of factors, some of which are harder to predict than others. In the short-term, the main drivers of demand include:
- Farm economics and the macroeconomic outlook
- Crop prices and fertilizer-to-crop price ratios
- Crop mix, growing areas and crop yields
- Soil nutrient levels and nutrient replenishment
- Policy, regulation and fertilizer subsidies
- Sustainability, nutrient management and recycling.
The importance of these factors varies from country-to-country and region-to-region. Adding to the complexity, these primary drivers are in turn influenced by a host of secondary considerations.
Macroeconomic conditions, by triggering slowdowns or expansions in global, regional and national growth, control overall economic demand and affect the health of agricultural markets. Farm economics and attendant issues such as credit availability and barter ratios have a more direct impact on the ability of farmers to purchase fertilizers.
Crop prices and fertilizer-to-crop price ratios act as key controls on crop nutrient demand as they play a critical role in determining farm buying power and fertilizer affordability. Crop prices in turn are driven by the harvest size annually, stock levels and demand for agricultural commodities. Fertilizer industry analysts pay particularly close attention to the prices of cereals, oilseeds, cotton, sugar and palm oil, the main fertilizer-consuming crop types globally.
The biofuels market is also an important driver of fertilizer demand due to large-scale cultivation of maize and sugarcane for ethanol and oilseed rape (canola) for biodiesel (Fertilizer International 474, p22). Crop failures due to extreme weather events such as the 2015/16 El Niño (Fertilizer International 475, p38) can also affect fertilizer demand in the short-term.
Spring 2019: The worst US planting season in history
Record rainfall disrupts
Canadian fertilizer giant Nutrien infamously described spring 2019 as “the worst US planting season in history”. It noted that record rainfall in the first six months of the year prevented crop planting over a massive 10 million acres – a new US record. This followed and compounded a poor US fall application season for fertilizers in 2018.
Chuck Magro, Nutrien’s president and CEO, said as early as last summer that “US weather in the first half was so severe it nearly eliminated global demand growth for crop inputs”, a prediction largely confirmed by IFA’s latest global demand estimate. Magro did, however, expect a strong US rebound in 2020 due to lower crop inventories and higher crop prices, with demand for grains and oilseeds still growing.
Phosphate plummets
Based on current IFA estimates, a fall in phosphate use was responsible for more than 75 percent of the total 1.3 million nutrient tonne decline in world fertilizer demand in 2018/19 (Table 1). North American market conditions are again implicated.
Bad fall 2018 and spring 2019 application seasons in the US were exacerbated by a large build-up of phosphate import volumes. The consequent carry-over of phosphate inventory has remained a concern in North America. “With a poor fall season and then a disappointing spring season, probably about 800,000 tons of [product] demand was lost. At the same time, we had one million tons more imports into the US, exacerbating the problem along with the flooding along the [Mississippi] river,” Mosaic commented last July.
Not only North America
North America market conditions were not the sole factor at play, however. Significant declines in fertilizer use in Turkey, China, Vietnam, Ukraine and France – totalling around 1.1 million nutrient tonnes – also took place in 2018/19. These falls were, however, largely offset by demand gains in India, Argentina, Myanmar, Thailand and Russia. The upshot of this is that global fertilizer demand would have remained stable in 2018/19 were it not for exceptionally bad US agricultural conditions.
The IMF reports that major central banks have relaxed monetary policy to reduce the downside risks to growth. This pre-emptive move should help offset the negative impact of the US–China trade dispute, which alone is expected to cut global GDP by 0.8 percent in 2020. Nevertheless, the IMF has singled out advanced Asian economies, including Hong Kong, Korea, and Singapore, for some of the biggest downward revisions to growth – due to their common exposure to China’s growth slowdown and the fallout from that country’s trade dispute with the US.
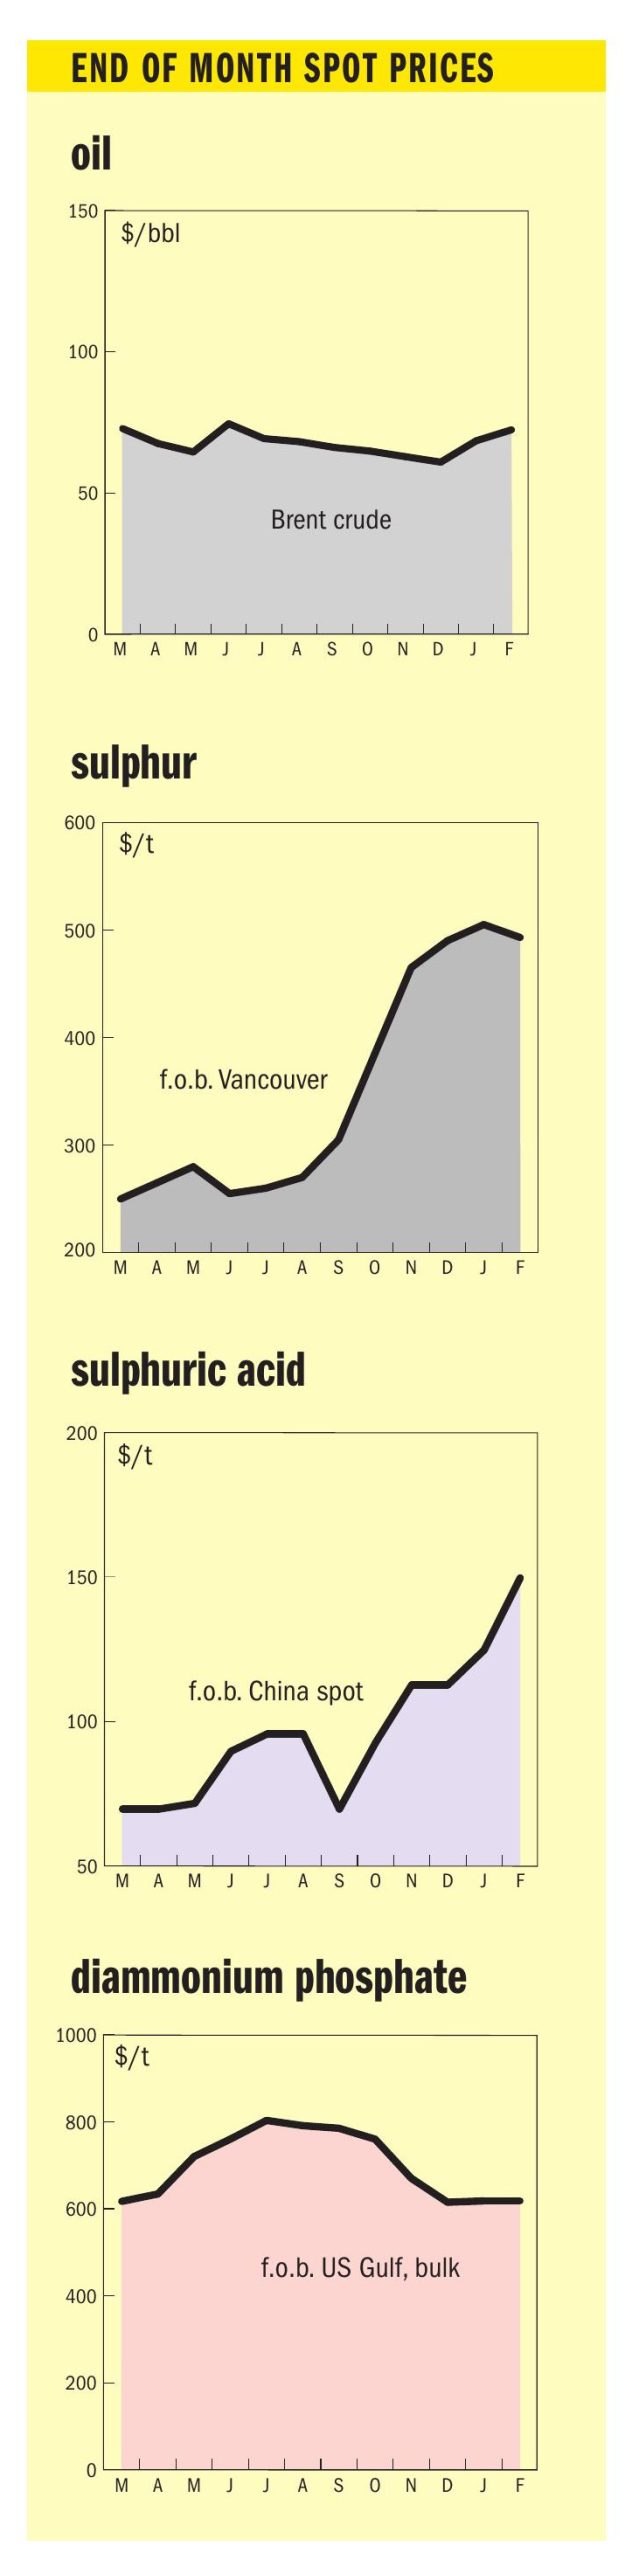
Oil prices fluctuated in 2019 but fell year-on-year. They rallied to exceed $71/ barrel in April, their highpoint of the year, only to bottom at $55 in August, before rebounding back above $60 in September.
Oil prices were pushed higher in the year’s first-quarter by a host of factors, including outages in Venezuela and US-Iran tensions, only to decline from late spring onwards. The prospect of lower demand from a faltering global economy was amplified by a build-up of US crude stocks. Prices subsequently recovered in September following an attack on two key Saudi Arabian oil installations. This temporarily knocked out 5.7 million barrels per day of production – about half of Saudi Arabia’s total and equivalent to 5 percent of global oil production. This stoked fears of oil market disruptions and escalating tensions with Iran.
Looking ahead, average oil prices, projected at $61.8 a barrel in 2019 – itself a 9.6 percent year-on-year decrease from the 2018 average – are forecast to decline further to $57.9/barrel in 2020, and ultimately to around $55/barrel by 2023 – a trend linked to “subdued medium-term demand prospects”.
Food prices surge to two-year high
As 2019 drew to a close, the FAO’s Food Price Index (FPI) reached a 26-month high in November 2019, averaging 177.2 points. This pushed the index up by nearly 10 percent (15.4 points) from a year ago.
November’s price hike – driven largely by significant surges in the prices of meat and vegetable oils – pushed the overall value of the FPI to its highest level since September 2017. Sugar prices also increased in November, while dairy prices remained steady, and cereal prices drifted downwards.
The November 2019 vegetable oil price index (150.6 points) reached its highest level in 18 months. The rise was led by firming palm oil values, although soy, rapeseed and sunflower oil prices also increased. International palm oil quotations rose for the fourth consecutive month in November, continuing the recent rebound from the price lows that have characterised the past 12 months.
The latest increase in the sugar price index (181.6 points in November) was driven by the expectation that world sugar consumption will surpass production. Poor growing conditions in Thailand, India, France and the US in 2019/20 have increased the chances of a fall in global stocks.
The cereal price index, in contrast, declined to 162.4 points in November. Large export supplies and stiff export competition weighed on international wheat prices, while rice values also fell to six-month lows, pressured by new crop arrivals and sluggish import demand.
Ag commodity outlook: no respite from risks
Millions of the world’s farmers face impoverishment in 2020 because of persistent geopolitical risks and intense price pressures, according to the annual outlook from agribusiness specialists Rabobank.
Strong headwinds – including the US-China trade war, fallout from African swine fever (ASF) and low crop prices – will take their toll on agricultural commodity producers next year, predicts Rabobank.
Soybeans, coffee and sugar will be particular key commodities to watch in 2020, in its view.
Although the bank foresees price increases in 2020, coffee and sugar are still likely to trade below the cost of production for much of the year – damaging the livelihoods of millions of coffee and sugar farmers as a result. The oversupply of coffee and low prices in 2019 have already pushed millions of farmers – mostly in Central America, East Africa and Southeast Asia – into poverty.

In 2020, global agriculture faces a continuation or escalation in the US-China trade war, alongside further increases in productivity on the back of more benign global weather, and the ongoing impact of the ASF crisis in Asia. These factors mean farmers will need to cope with further uncertainty in 2020, after years of relatively low prices.
Geopolitics, particularly trade disputes, looks set to be the key driver of grain and oilseed prices this year, in Rabobank’s view. The soybean market in particular will continue to be at the mercy of the US-China trade war, although coffee and sugar prices look set to recover from decade lows.
Stefan Vogel, Rabobank’s head of agricommodity markets, said: “The world’s farmers have endured a difficult year with headwinds caused by geopolitical tensions, disease and weather. Yet sadly for them, 2020 looks like offering no immediate respite.
“In the worst-case scenario, coffee farmers face the prospect of stubbornly low prices while trade tariffs threaten soybean farmers.”
“The hope is that the worst does not occur. In a more favourable scenario, the US and China resolve their trade dispute, China begins to replenish pork herds, stimulating demand for soybeans, and the coffee market rebalances, increasing the prices paid to farmers for their beans.”
There are downside risks, however, with Rabobank warning of a significant chance of recession in US, the world’s largest economy, in the second half of 2020 – a downturn that could reduce global demand for staples such as coffee and cocoa. The main impact of such a recession, though, would be a synchronised global slowdown. This could weaken currencies in key commodity-producing countries with negative consequences. A weaker Brazilian real, for example, would largely thwart any recovery in coffee and sugar prices.
Fertilizer demand
Following an unexpected market contraction last year, the International Fertilizer Association (IFA) expects world fertilizer demand to recover slowly as we move into 2020 and beyond.
Global fertilizer consumption declined year-on-year in 2018/19 for the first time in a decade, according to IFA estimates, falling by 0.7 percent to 188.8 million nutrient tonnes (Table 1, Figure 1)2 . This decline in global demand was especially marked for one nutrient (phosphate) and strongly affected by one factor in particular – a sharp weather-related contraction in US fertilizer use (Fertilizer International 492, p4; see box). Indeed, North American fertilizer demand fell by an unprecedented 5.7 percent in 2018/19, equivalent to 1.4 million nutrient tonnes2 .
IFA expects fertilizer demand to return to growth this year driven by a strong recovery in North America. However, the overall 0.9 percent recovery in global demand forecast in 2019/20 – equivalent to a 1.8 million tonne increase to 190.6 million nutrient tonnes (Table 1) – is still below the medium-term trend. It also represents a major downgrade in fertilizer consumption since IFA’s previous June 2019 forecast2 .
Nevertheless, in a complete reversal on the previous year, demand in 2019/20 should be boosted by a resumption of phosphate consumption, with a healthy year-on-year percentage rise in demand for this nutrient.
The market recovery in 2019/20 will also be aided by rising fertilizer use in India, Brazil, Russia and Canada. This will offset a significant – albeit largely expected – decline in consumption in China of around one million nutrient tonnes. Fertilizer use is also expected to fall in Southeast Asia (Indonesia, Malaysia, Thailand), linked to unfavourable weather and lower palm oil prices, and parts of Latin America (Colombia) in 2019/202 .

Looking further ahead, fertilizer consumption is forecast to accelerate into next year, with growth returning closer to the medium-term average. IFA’s preliminary forecast is that growth in global fertilizer use will pick up by 1.3 percent and total 193.0 million nutrient tonnes in 2020/21 (Table 1, Figure 1). This is based on an expectation of higher crop prices and average weather conditions. Increases in potash consumption are forecast to be particularly firm. Growth next year, although broad-based, looks likely to be led by Indonesia, Brazil and India2 .
Global production and trade
Between 2018 and 2023, the global industry expects to invest close to $110 billion in constructing 70 new fertilizer manufacturing units, these providing a total of 65 million tonnes of extra production capacity. Large-scale investments in nitrogen capacity will take priority, accounting for two-thirds of planned capital expenditure over the next five years1 .
The global supply of primary fertilizer raw materials (ammonia, phosphate rock and potash) is expected to grow by 2.2 percent to 260 million tonnes nutrients in 20202 . This total does, however, include tonnages for industrial and other non-fertilizer uses, estimated at 51 million tonnes in 2019.
Unusually, increases in potash production capacity were outweighed by decreasing ammonia and phosphoric acid capacity in 2019, resulting in a net reduction in global capacity of 1.7 million tonnes nutrients, according to IFA estimates. This capacity contraction in 2019 reflected already announced closures and mothballing of ammonia, potash and phosphate production units. This contraction looks like being a one-off, however, and is expected to be reversed by a substantial 6.3 million tonne increase in nutrient supply in 20202 .
Urea: Preliminary estimates suggest that global urea exports – equivalent to almost 30 percent of world production (176 million tonnes) – increased marginally (+0.6%) to 48.5 million tonnes in 2019. China’s return to the urea market was a major development last year. Urea exports to Indonesia, Canada and Ukraine increased significantly in 20192 .
World urea capacity is projected to grow by just one percent in 2019 and 2020 to reach 213 million tonnes. Capacity is expected to recover this year after faltering in 2019. The capacity stall was linked to the ongoing decrease in Chinese capacity (-2.4 million tonnes) plus plant closures or mothballing in Romania, Kuwait and Brazil (-2.4 million tonnes). New urea capacity is, however, expected in India (+2.6 million tonnes), Nigeria (+2.4 million tonnes) and Azerbaijan, Uzbekistan and Russia (+1.5 million tonnes) in 2019 and 20202 .
Phosphates: Global production of finished phosphates increased in 2019, rising to 74 million tonnes, according to preliminary IFA estimates. This was thanks to higher monoammonium phosphate (MAP) output and a strong recovery (+9% year-on-year) in diammonium phosphate (DAP) production. DAP exports expanded by seven percent year-on-year in 2019, with extra tonnages emerging from Morocco, Saudi Arabia, China and the US. DAP import growth was led by Turkey, India and Canada. MAP exports also increased strongly in 2019, being partly driven by with a robust recovery (27% year-on-year) in internationally-traded Chinese product. Rising MAP sales to Brazil and Canada were particularly noteworthy2 .
Incremental increases in finished phosphates capacity are forecast in 2019 and 2020. These will mainly occur in Morocco, Saudi Arabia and Egypt (+1.4 million tonnes P2 O5 collectively) together with capacity expansions in Russia, Brazil, India and Turkey. This will be partially offset by plant shutdowns and mothballing in North America2 .
Potash: The soft conditions in the global potash market that prevailed in 2019 could well continue into 2020. Indeed, IFA expects the potash market to remain in a supply-driven phase in the near term, with new capacity projects in Russia and Belarus adding substantial export-dedicated production volumes. IFA is, however, forecasting a recovery in global MOP (muriate of potash) trade this year, with world demand rising to 53 million tonnes, a level last seen in 2017/182 .
World potash capacity is forecast to rise by 4.8 percent (+2.9 million tonnes K2 O) during 2019 and 2020 to reach 62.8 million tonnes K2 O. This will be largely driven by an expansion in Russian MOP capacity (+1.4 million tonnes). Preliminary figures, however, suggest world potash capacity grew only marginally in 2019 (+0.2%, +0.1 million tonnes K2 O). Restructuring in Germany and the UK removed significant MOP capacity last year (-0.4 million tonnes), partly offset by robust growth in sulphate of potash (SOP) capacity (+0.3 million tonnes)2 .
Summary analysis
Fertilizer demand growth has been on a downward trajectory over the last ten years.
In retrospect, the market seems to have undergone a sea change around a decade ago. Global fertilizer demand – which dropped sharply in 2008/09 but rebounded in 2009/10 and 2010/11 – has subsequently grown at a slower pace. The average annual growth rate between 2011/12 and 2017/18, for example, was just 1.2 percent. That compares with growth of 2.6 percent p.a. between 2001/02 and 2007/08, the equivalent period in the previous decade2 .
Indeed, global growth in fertilizer use has slowed sharply in recent times, falling from 4.3 percent in 2011/12 to 0.8 percent in 2017/18. This growth slowdown has been partly driven by lower agricultural crop prices. Other factors include government policies and adverse weather in large consuming countries2 .
Contracting consumption in China since 2015/16 has acted as a drag on world fertilizer use. It is therefore, India, once again, which looks set to be the strongest driver of market growth in 2020 and into 2021, although the subcontinent is no longer the engine of demand growth it once was. Instead, since 2011/12, growth in world fertilizer consumption has become much more dependent on smaller, more dynamic markets in three regions: Latin America (Brazil, Mexico), Eastern Europe (Ukraine, Russia) and Africa (Ethiopia, Nigeria, South Africa).
A notable feature of the current short-term outlook is the volatility in fertilizer demand with a series of alternate year-on-year expansions and contractions expected in a number of key markets. This is true of the United States, Indonesia and Argentina. Fertilizer consumption in the US, for example, is likely to experience zero growth between 2017/18 and 2020/21 because of this volatility.
Major uncertainties and downside risks also abound. These include the slowing pace of world economic growth, the state of US-China trade relations, and the serious swine fever outbreak in China and neighbouring countries.
References