Sulphur 390 Sept-Oct 2020
30 September 2020
SO2 emissions control
SULPHUR DIOXIDE
SO2 emissions control
Legislation to control emissions of sulphur dioxide continues to tighten, via vehicle exhausts, and refinery and smelter emissions, leading to increased recovery of both sulphur and sulphur dioxide.
The sulphur industry has arguably achieved its present form due to atmospheric sulphur dioxide pollution, and attempts to control it. Flaring of acid gas recovered from sour gas in places such as Alberta led to SO 2 plumes and a move to recover the sulphur prior to combustion back in the 1950s, and the beginnings of recovered sulphur as a major source of brimstone.
During the 1970s and 80s, the ‘acid rain’ phenomenon in Europe and North America was traced to SO 2 from coal burning power plants and industrial locations, and the move to rein in SO 2 began in earnest, via a combination of measures, including encouraging switching away from coal-burning power stations towards natural gas or other cleaner sources, and the installation of flue gas desulphurisation (FGD) technology at remaining coal-fired power stations, and the mandating of progressive reductions in sulphur content of liquid vehicle fuels.
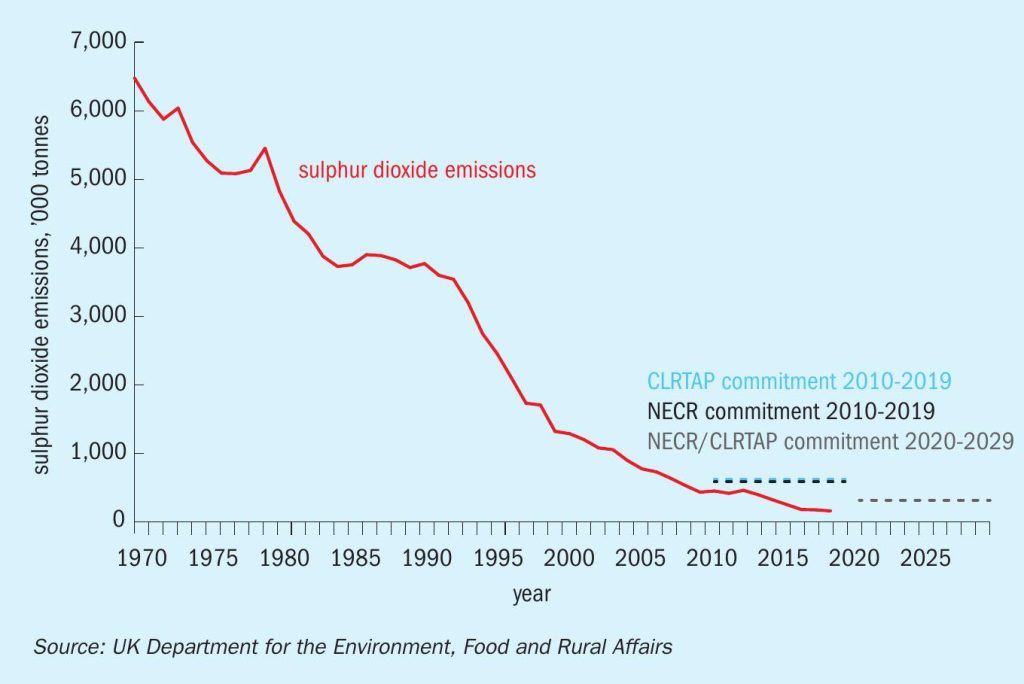
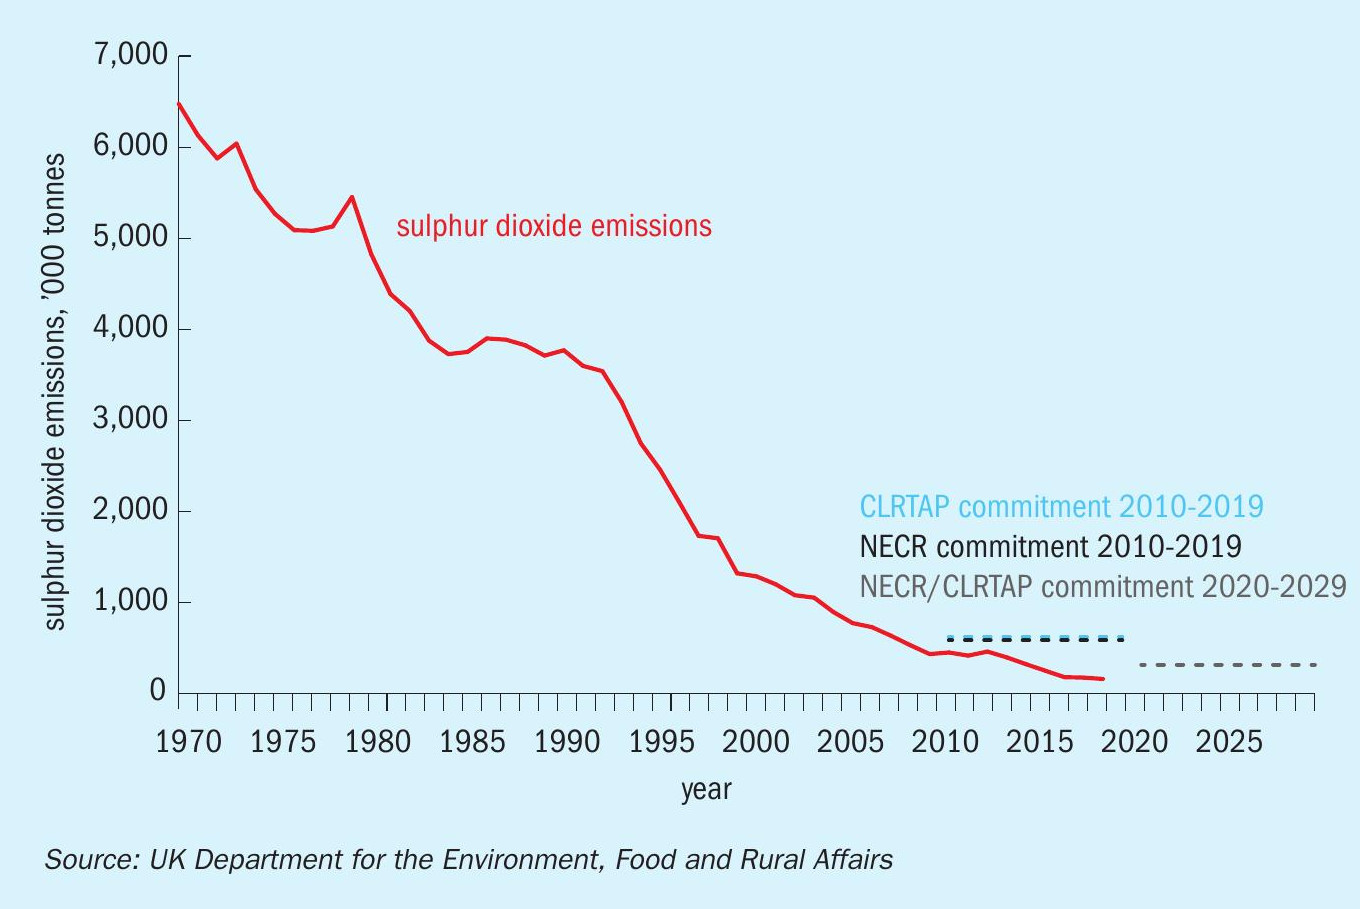
The effect has been dramatic. As Figure 1 shows, UK SO 2 emissions have fallen by something like 98% in the period from 1970 to 2018. Comparable figures from the US Environmental Protection Agency likewise show a 92% reduction in man-made SO 2 emissions over the period 1980-2019 due to the US Clean Air Act. The EU has seen a 74% reduction from 1990-2011 via its National Emission Ceilings Directive. The UK has achieved this reduction primarily from switching from coal to natural gas and more recently renewable power generation, and FGD – around 75% of 1970 emissions came from coal-fired power stations.
These reductions have not only prevented the acidification of lakes and forests from acid rain, but also improved human health, as the evidence of SO 2 aerosols as damaging to lungs even at relatively low levels continues to increase.
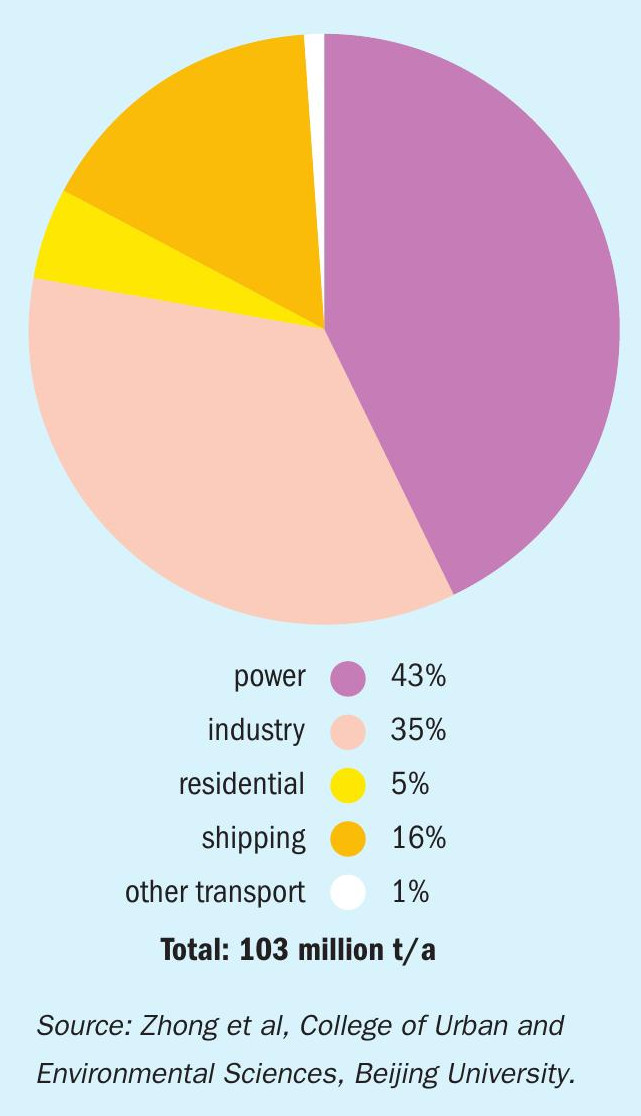
However, global SO 2 emissions still remain relatively high. Figure 2 shows figures collated by Chinese researchers in 2014, which put anthropogenic SO 2 emissions to atmosphere at around 103 million t/a. This is approximately equivalent to emissions from natural sources, mainly volcanoes, but also large scale forest fires, which is around 75-100 million t/a.
Remaining SO 2 sources
Figure 2 identifies three major remaining sources for human SO 2 emissions; power generation, ‘industry’ – mainly smelting and refining – and shipping. The latter, of course, is what has led to the International Maritime Organisation’s concentration on reducing sulphur in bunker fuels, which has seen a maximum sulphur fuel concentration of 0.5% overall, and 0.1% in designated emission control areas, mainly the Mediterranean and Baltic Seas and the east and west coasts of North America.
Other transportation, meanwhile, is now only a relatively small slice of overall emissions. Reductions of sulphur content of road vehicle fuels have brought sulphur levels to 15 ppm or less in most nations, and those that don’t are likely to reach at least a level of 50 ppm. As Figure 2 shows, transportation emissions excluding international shipping are already only 1% of global anthropogenic SO2 emissions.
The greatest gains that remain to be made are from the power and industrial sectors. While flue gas desulphurisation is widely used in OECD countries, its use is patchy outside of this, and SO2 pollution from power plants has become a major issue in some countries which rely upon coal for power generation, particularly India. In 2019 India was named as the world’s largest emitter of SO2 in a Greenpeace report, responsible for 15% of global SO2 emissions. It was striking that the lockdown of Indian power plants earlier this year due to the Covid pandemic led to a temporary 40% fall in SO2 concentrations across the country. India’s Ministry of Environment, Forest and Climate Change introduced SO2 emission limits for coal-fired power plants in December 2015, but the deadline for the installation of the FGDs in power plants have been shifted from 2017 to 2022. This contrasts with China, where widespread use of FGD has reduced SO2 emissions by 75% this century in spite of a 50% increase in coal-fired power generation.
Outside of power generation, it is evident that industry still remains a major polluter, especially the metal refining sector. The largest peak emissions source in the world according to satellite monitoring is the Norilsk Nickel refinery, responsible for 1.9 million t/a of SO2 emissions on its own in 2018. Nor are smelter emissions confined to the developing world. Canadian figures show that between 1990 and 2017, SOX emissions decreased by 69% to 954,000 t/a in 2017. However, of the remainder, 28% of the emissions are from smelting operations, compared to only 6% in the United States, and for the province of Ontario, the smelting contribution is 72%.
Another 26% of Canada’s emissions came from the oil and gas industry, and this sector also remains a major emitter of SO2 . Numbers 3 and 4 on the list of global SO2 ‘hotspots’ are the Zagroz petrochemical complex in Iran and the Rabigh complex in Saudi Arabia, and installations in Mexico and the UAE are also in the top ten. Saudi Arabia is actually another of the countries where SO2 emissions are still rising.
Implications for sulphur
While FGD in the power sector generates gypsum as a by-product, and hence is tangential to the sulphur industry, sulphur dioxide emissions control at refineries and gas plants will generate additional sulphur, and, from metal smelters, sulphuric acid. At present, SO2 abatement measures are responsible for generating 65 million t/a of elemental sulphur worldwide, and another 80 million t/a of sulphuric acid from smelters (equivalent to 26 million t/a of sulphur). However, as Figure 2 shows, industrial emissions still represented another 36 million t/a of SO2 in 2014, equivalent to 18 million t/a of elemental sulphur. This means that further reductions in sulphur emissions from smelters – which has become a contentious issue in many countries, from India’s Vedanta smelter to La Oroya in Peru – and further reductions in flaring of sulphur-rich gas from the Middle East and elsewhere still have the potential to drive large increases, as SO2 emissions legislation continues to tighten.