Sulphur 401 Jul-Aug 2022
31 July 2022
The consequences of condensate formation in acid plants
CORROSION CONTROL
The consequences of condensate formation in acid plants
Condensate formation in sulphuric acid plants can cause severe corrosion problems leading to high maintenance and plant downtime. Santhosh S. of Metso Outotec discusses the importance of carrying out regular monitoring and maintaining accurate and detailed data about condensate to increase equipment life and avoid downtime. Different sources of condensate formation in the plant are discussed as well as the typical locations in the plant where the condensates end up.
The condensate in a sulphuric acid plant is a key indicator of its overall condition. If left unchecked or not given sufficient attention, it can cause severe corrosion problems leading to high maintenance and downtime of the plant.
Not much importance has been given to this subject in the majority of acid plants and record keeping of condensate readings are rarely followed.
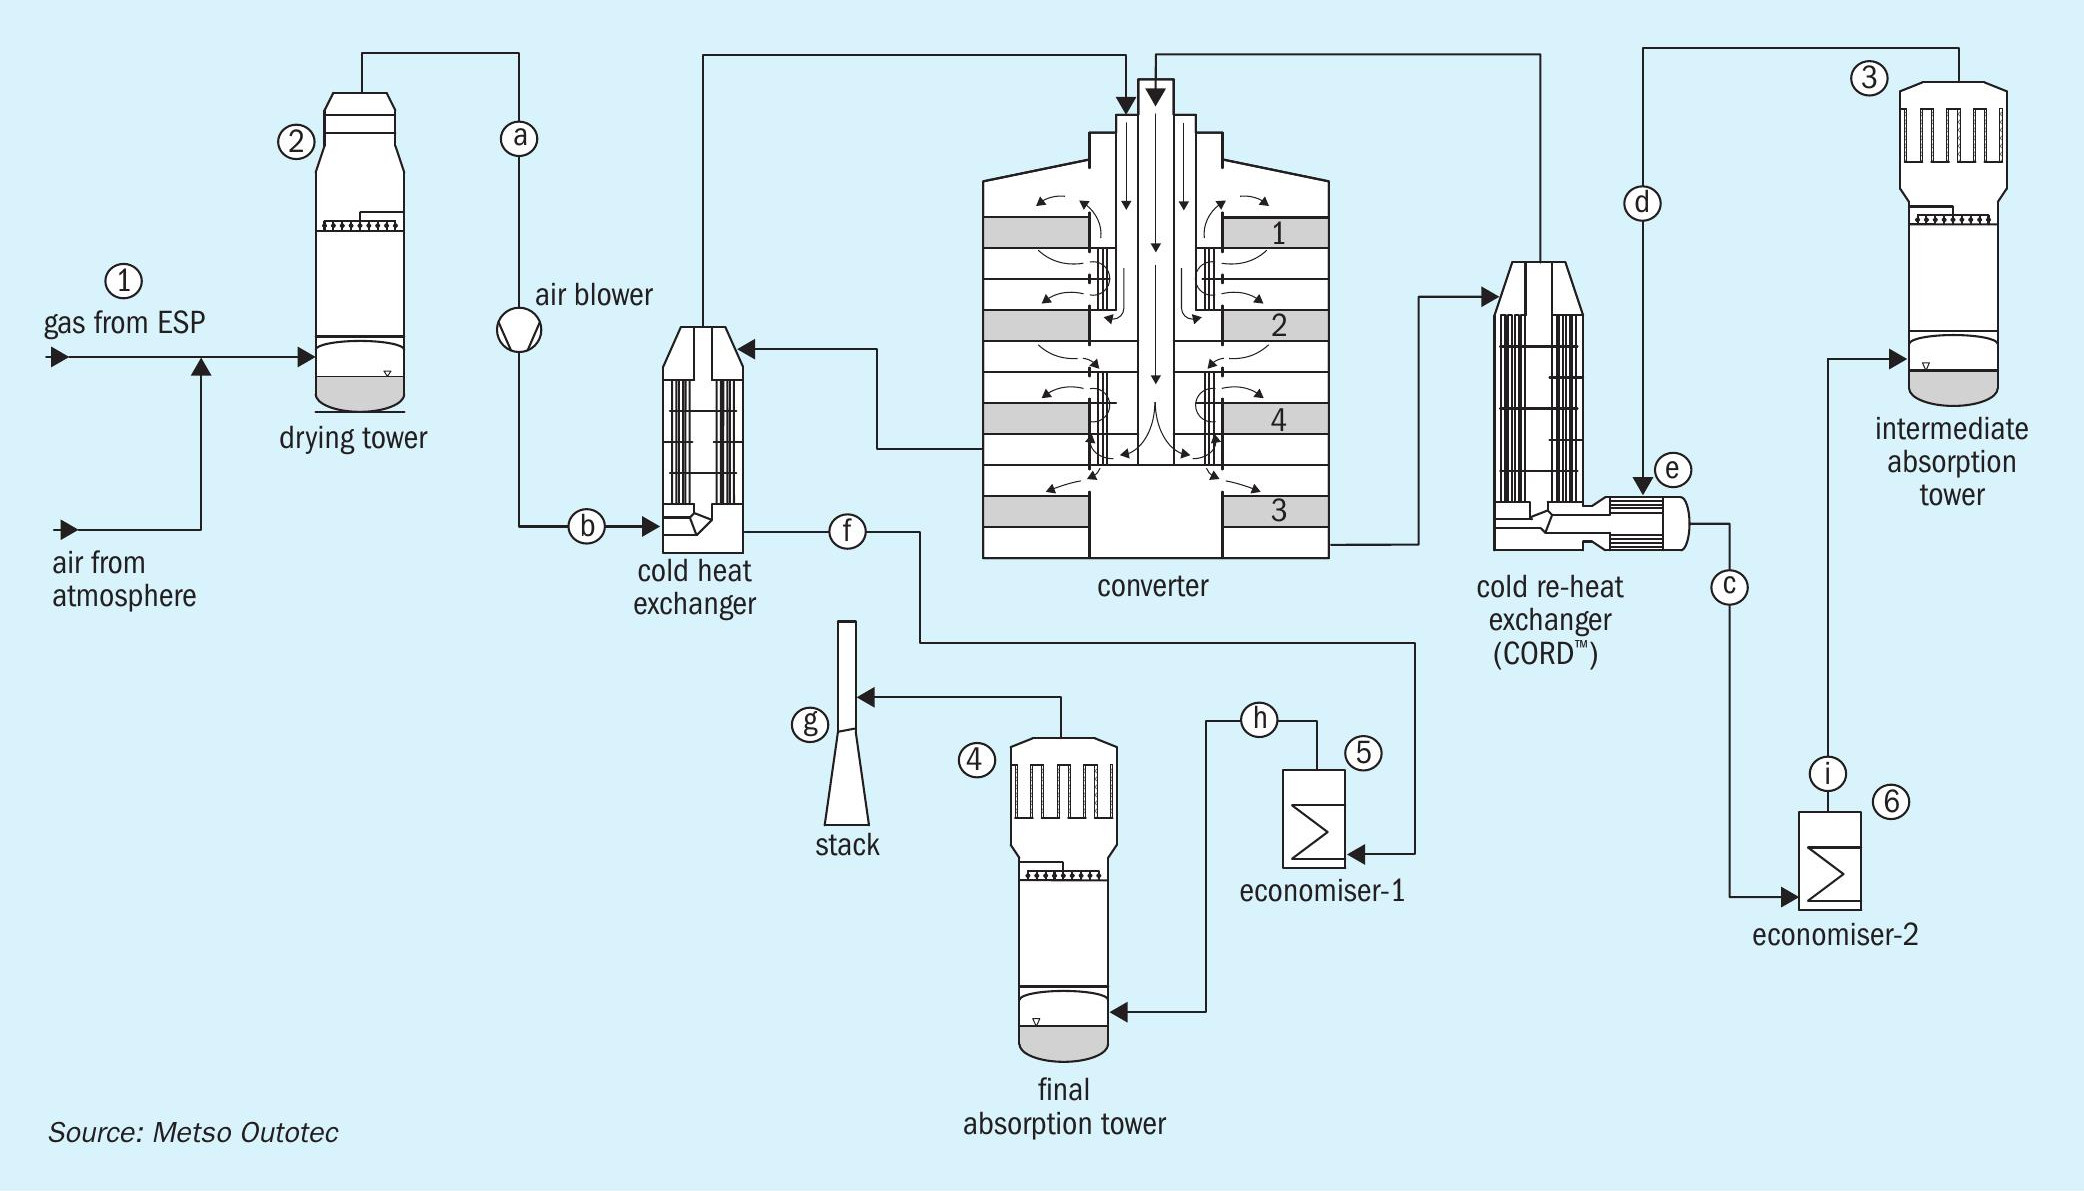
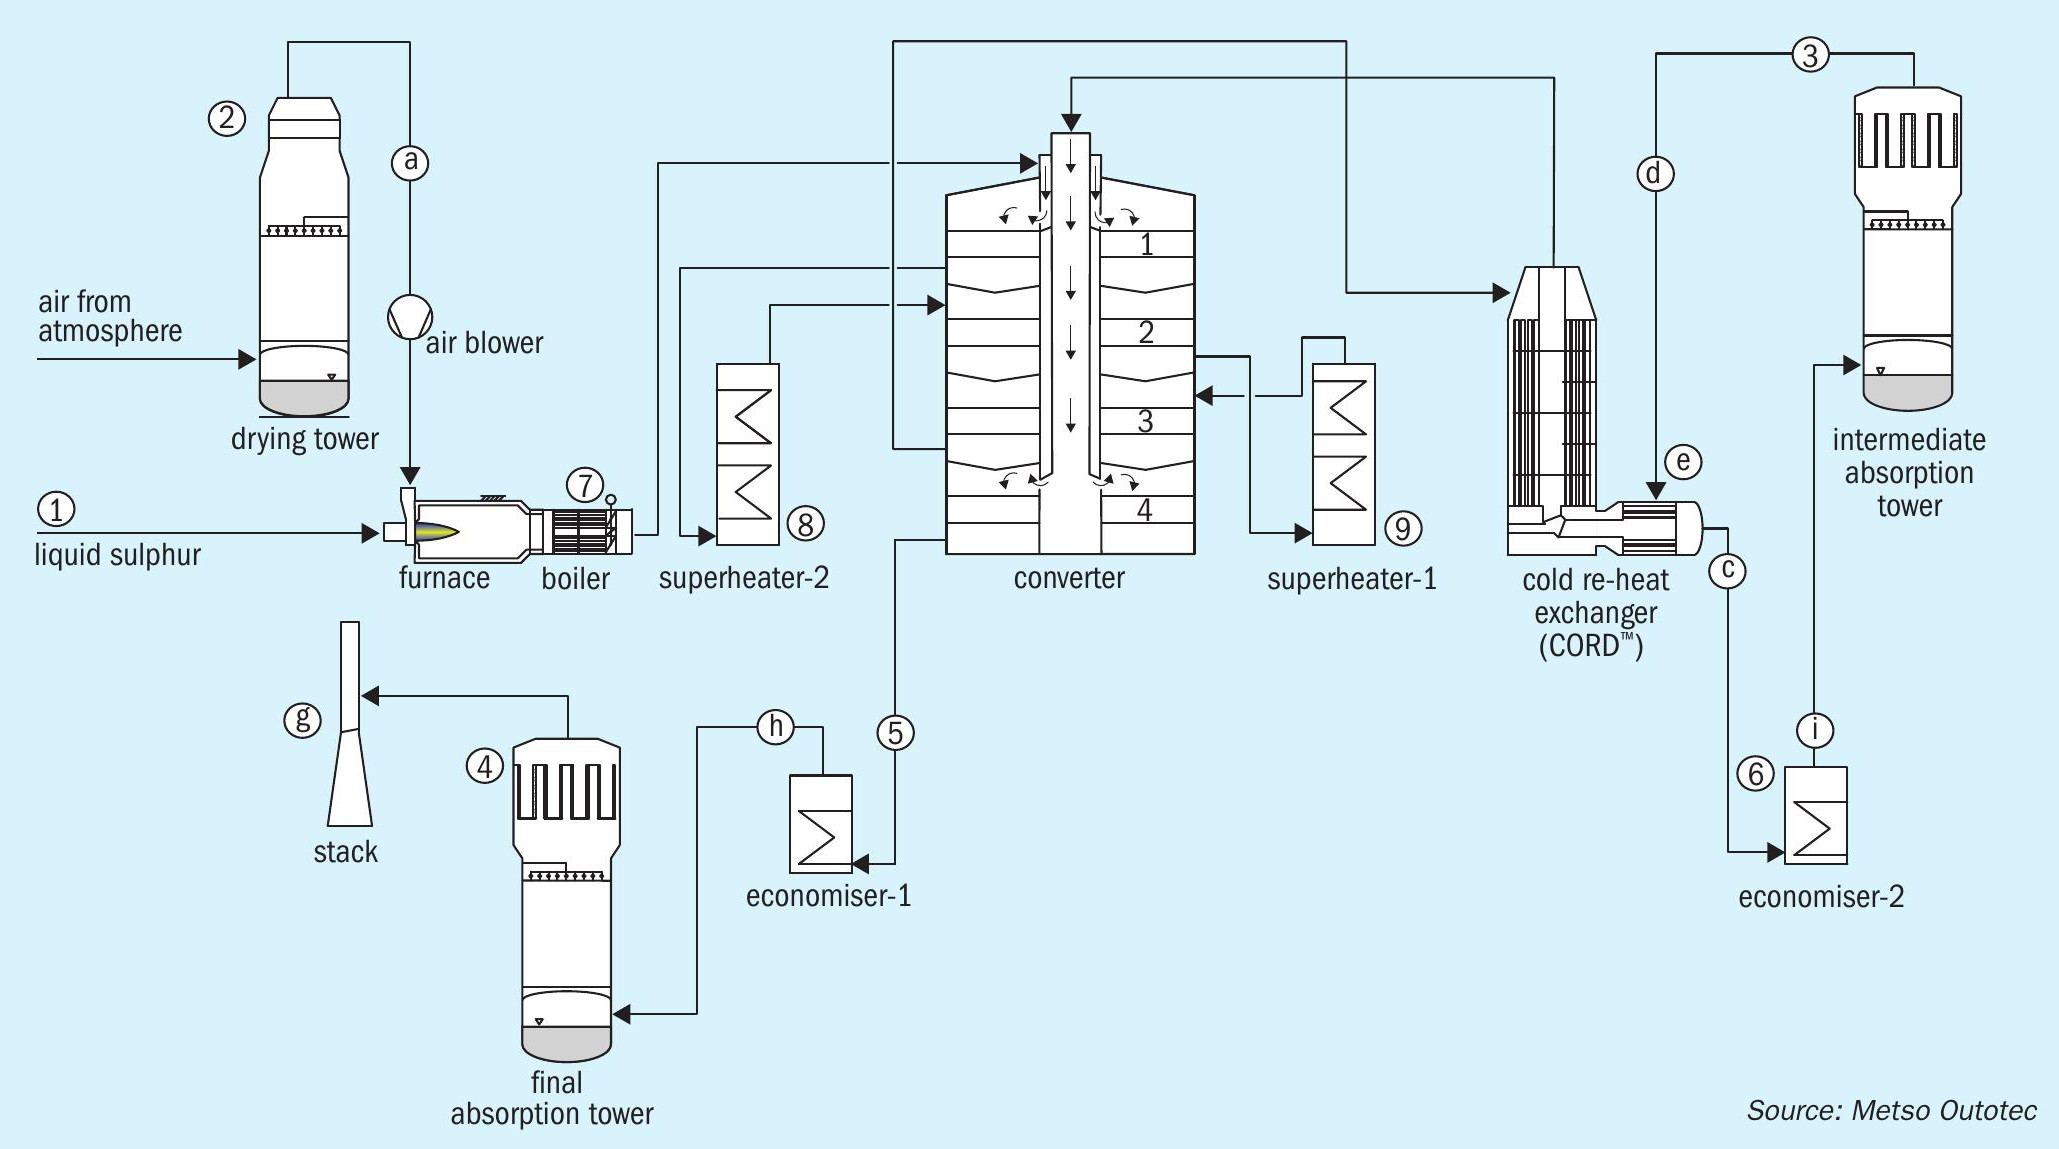
The following sections aim to throw some light onto this subject pertaining to both metallurgical and sulphur burning plants. In the acid plant flowsheets shown in Figs 1 and 10, various sources of condensates are marked with numbers and the locations of where they tend to show up is marked with letters for easy reference.
Metallurgical acid plants
A flowsheet of a typical metallurgical acid plant is shown in Fig. 1.
Typical sources of condensate are highlighted in the following sections.
Wet electrostatic precipitator (1)
99% of the residual mist contained in the gas leaving the wet electrostatic precipitators (ESPs) are generally <1 micron in size and poor function of the ESPs can lead to a stack plume (g). Submicron particles will neither evaporate nor condense as condensate collection due to the fineness of the mist and thus can persist throughout the acid plant. If there is a considerable amount of NOx present, the colour of the plume may be yellowish to brownish.
Drying tower (2)
The next source of condensate can originate from the drying tower (DT). It is mainly caused by acid carryover or poor gas drying.
- Acid carryover from the DT will be first evident on the acid trap (a) located on the DT outlet duct. Usually, the outlet duct from DT is sloped downwards and the trap is located on the bottom of the duct, upstream of the main blower gas inlet. A periodic record of the quantity of condensate with relation to airflow/ production from the time of plant startup is necessary to compare the severity of acid carryover. Acid condensing at the gas duct wall and larger drops can be separated there. Provided that the DT-demister is functioning properly, no significant quantity of condensate will be collected at this acid trap. However, smaller droplets will pass on further downstream of the plant, usually impacting on the shell side of the cold heat exchanger CHE (b), thus separating from the gas-flow, and drain as condensate from the shell side. Part of those droplets/mist will pass through the heat exchanger and partly evaporate into gaseous H2 SO4 , which will subsequently condense at “cold” surfaces, e.g., the tube-side of the cold reheat exchanger i.e., bed 3 outlet stream (c).
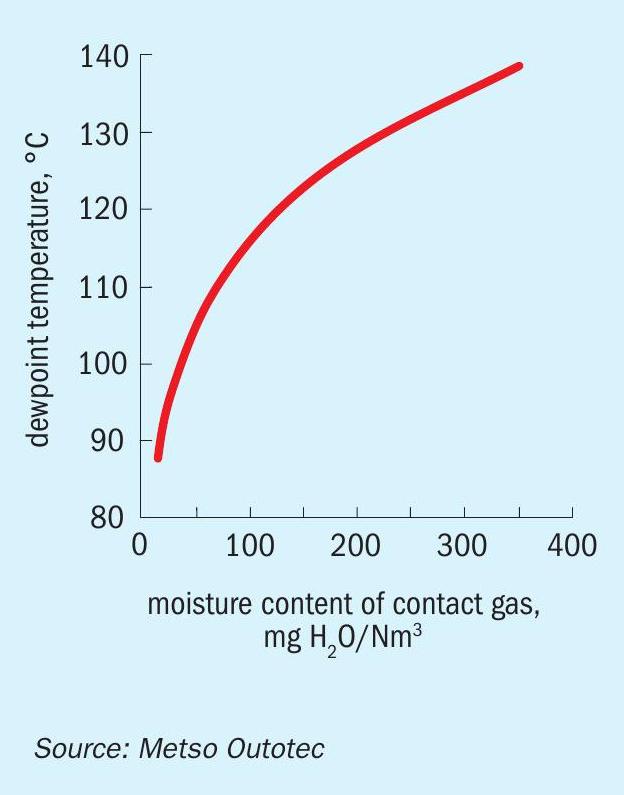
- Poor gas drying leads to moisture slippage and will lead to the formation of H2 SO4 vapours after the reaction with SO3 formed in the converter. Due to the high temperature in the converter, they remain as vapour but start to condense as soon as they are exposed to cold spots with a temperature lower than the dew point of the gas. The dew point of the gas is directly proportional to the moisture content of the gas as shown in (Fig. 2).
From the graph in Fig. 2, it is evident that the higher moisture content will lead to higher dew points enabling condensate formation at higher temperatures. A moisture content of <30 mg/Nm3 is excellent, <50 mg/Nm3 is good and anything above 50 mg/Nm3 is not recommended and should be investigated. Moisture content of the DT gas exit should be tested at least twice a year to keep a record on the performance of the drying tower.
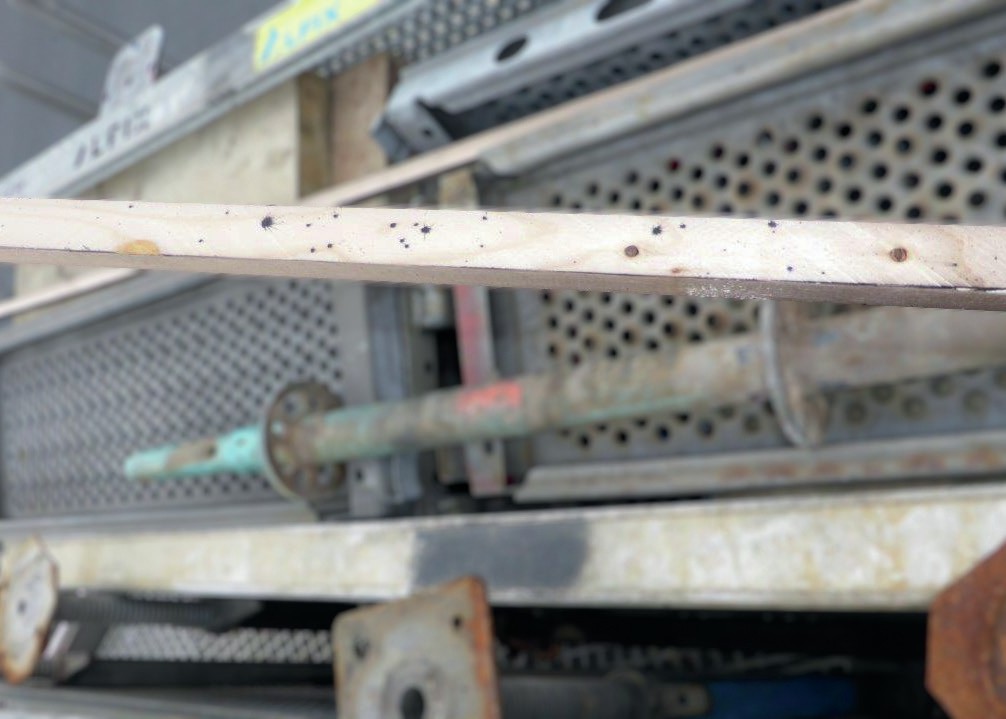
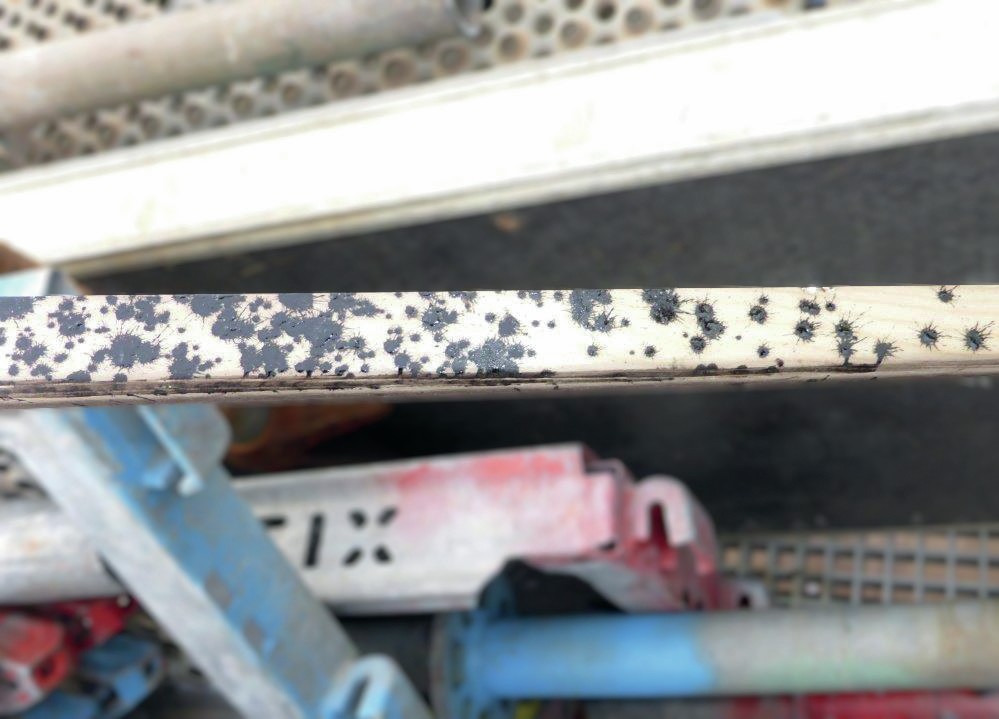
When the metal surface temperature on the tube side of the cold reheat exchanger drops below the dewpoint, acid condensation will occur there. A simple stick test on the DT outlet will allow the operator to conclude and identify the root cause of carryover in the drying tower and differentiate between acid carryover and moisture carryover. Once again records (photos, as shown in Fig. 3) of periodic stick tests vs gas flows will enable the history to be interpreted and will provide a better understanding of the present operating conditions.
Intermediate absorption tower (3)
The gas outlet of the intermediate absorption tower (IAT) is the next source of condensate in the metallurgical acid plant. It can be caused by acid carryover, wrong concentration leading to moisture content in the gas, or SO3 slippage.
Large droplet acid carryover from the intermediate absorption tower will be first evident on the acid trap (d) located on the IAT outlet duct. Although most of the quantity is collected on the trap, high loads of carryover will slip to the cold reheat exchanger typically on the shell side (e), and in severe cases it will appear on the tube side of the cold heat exchanger i.e., bed no. 4 outlet (f).
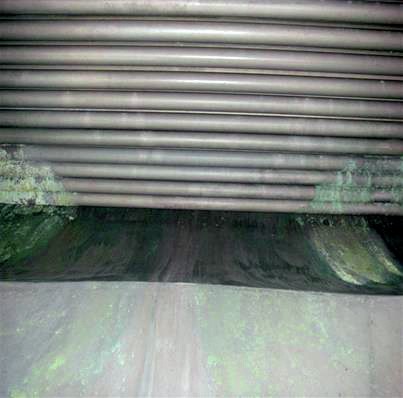
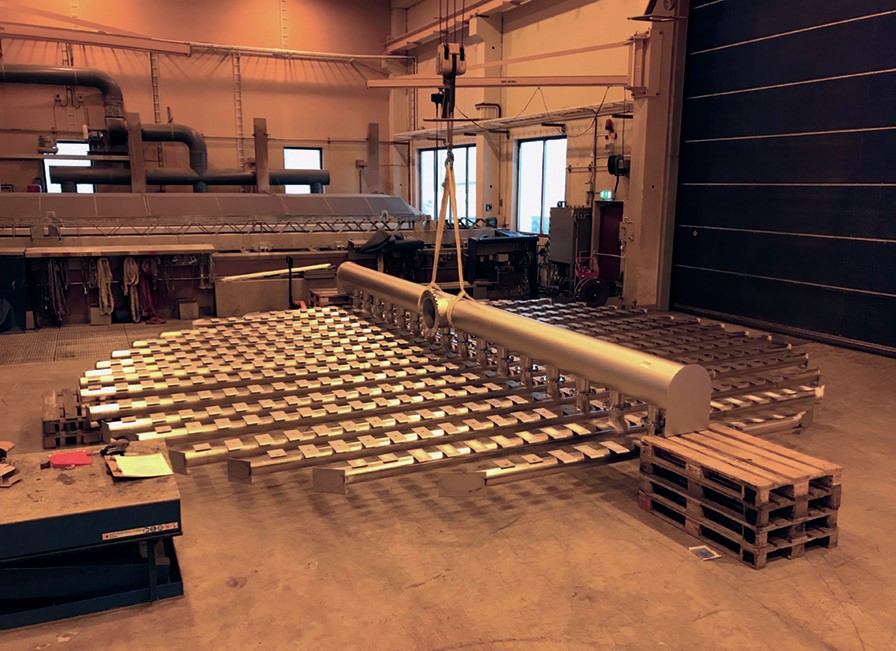
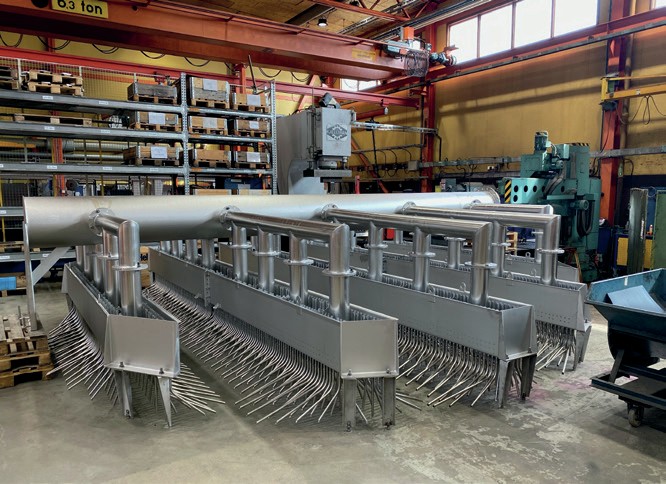
Condensation in the cold reheat exchanger will lead to corrosion of the tube walls, forming form sulphate scale, which in turn leads to higher pressure drop. High amounts of fouling will start to affect the heat transfer area of the exchanger (Fig. 4) and contribute to operating costs of the blower due to the additional pressure drop. Significant drain will reduce the lifetime of the heat exchanger and the whole unit will have to be replaced leading to significant capital investment and downtime.
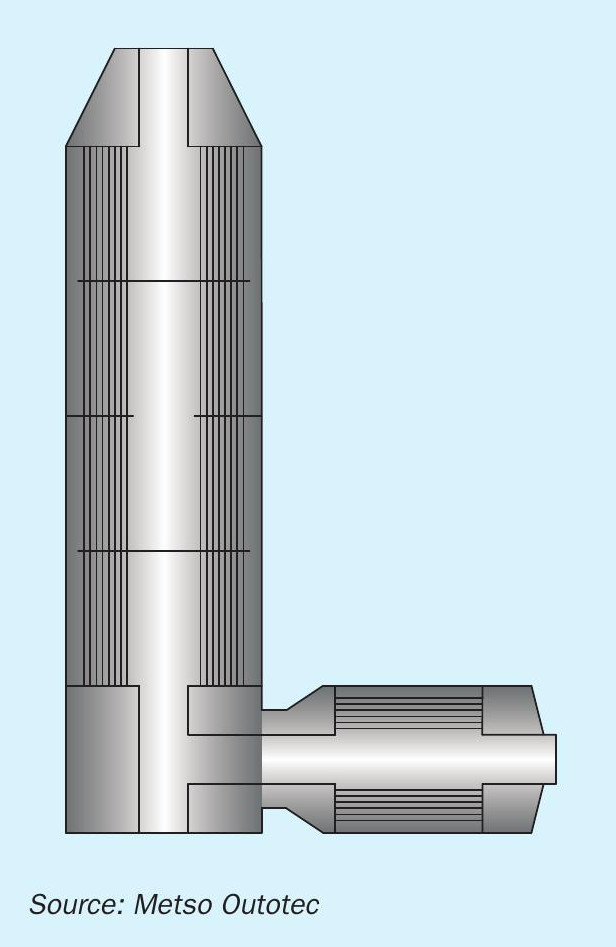
CORD™ heat exchangers of Metso Outotec plants (Fig. 5) are specially designed in view of this problem and to help reduce the corrosion damage in case of condensate problems. The CORD™ heat exchanger has a small stainless-steel bundle on the cold side of the gas where the condensation first occurs. The gas temperature at the outlet of this bundle is above the typical dew point temperature, which ensures the second bundle (the main tube bundle) remains free of corrosion. In case of corrosion, the small tube bundle can be replaced without touching the main long bundle, thus saving significant costs of replacing the entire heat exchanger.
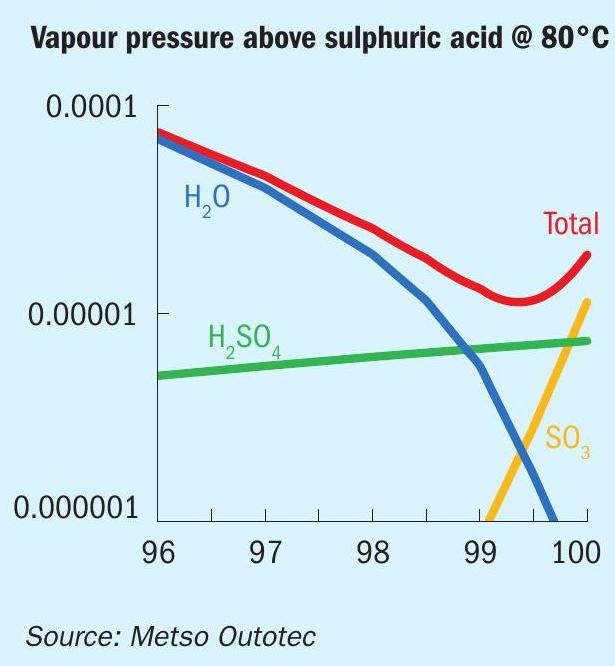
In the rare case of too low or too high acid concentration, resulting in low absorption and high partial pressures of water or SO 3 on top of the intermediate absorption tower, dew point condensation can occur as discussed earlier. Fig. 6 illustrates the partial pressures of the gas components above sulphuric acid at 80°C.
This is unusual as the operators generally have good control of the acid concentration to the tower. This will be evident on the cold heat exchanger tube side i.e., bed no. 4 outlet (f) which is the first cold location where H 2 SO 4 , SO 3 gas and moisture may condense.
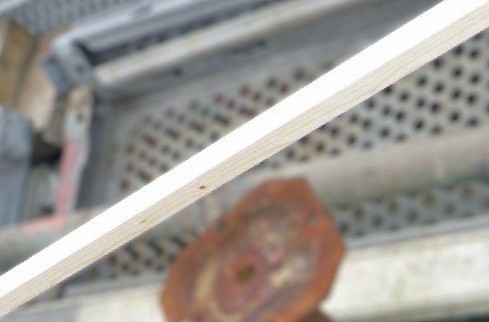
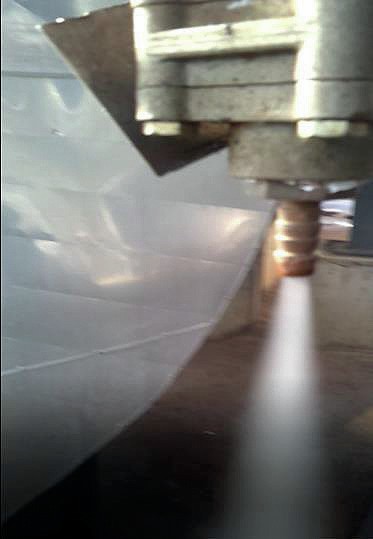
A simple stick test on the IAT outlet (Fig. 7) will allow the operator to identify larger droplet carryover and differentiate it from any vapour, e.g., SO 3 slippage. Once again, recording of periodic stick tests vs gas flowrate/plant load is necessary to analyse the current operating conditions.
Another simple test to identify SO 3 slippage from the intermediate absorption tower is to observe the colour of the gas from the IAT outlet from a sample point (Fig. 8). If the gas contains SO 3 , the gas becomes white as soon as it is in contact with moisture in air due to the reaction between SO 3 and water vapour.
The acid distributor design in the tower is also crucial to ensure good absorption and to minimise carryover. The acid irrigation rate, gas velocity, tower size etc. must be taken into consideration during the design phase and also duri 3 ng debottlenecking and capacity increase projects later on during operation.
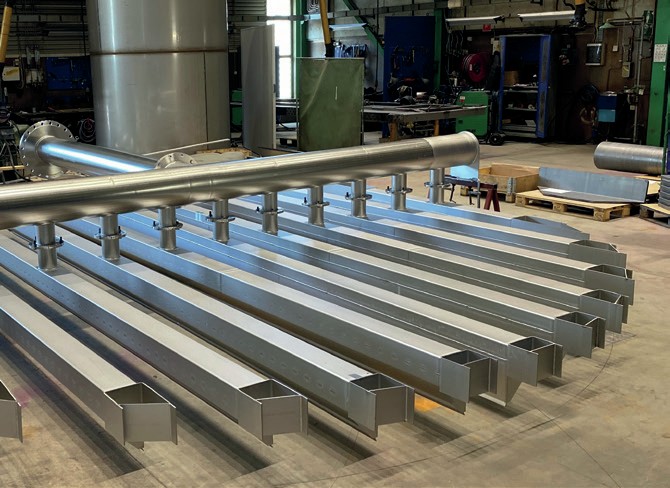
A dedicated branch of Metso Outotec in Gothenburg, Sweden, deals with the design of equipment in contact with acid and can offer solutions to design or debottlenecking requirements in the acid section (Fig. 9).
Final absorption tower (4)
The reasons for condensate from the final absorption tower (FAT) are similar to those already discussed for the intermediate absorption tower as both towers function in exactly the same manner and will appear in drain of the stack (g). High carryover will cause stack spitting and will require prompt action. Moderate amounts of condensate from a stack is normal. Again, regular stick tests provide valuable information on history and present operation.
Most countries have an emission norm requiring a limit of 25-30 mg/Nm³ of H 2 SO 4 in stack emissions.
Sulphur burning acid plants
A flowsheet of a typical sulphur burning acid plant is shown in Fig. 10.
Typical sources of condensate are highlighted in the following sections.
Sulphur (1)
Hydrocarbons in sulphur burn in the furnace to form carbon dioxide and water vapour. The water content will react with sulphur trioxide generated during the combustion of elemental sulphur with air resulting in the same phenomena as discussed in the drying tower section.
Drying tower (2)
The same reasons and detection methods apply as discussed in the metallurgical acid plant section.
Economiser-boiler-superheater (5-9)
Steam or water leakage from the waste heat boiler and superheater will cause rapid moisture ingress in the gas going into the converter. The steam/water will react with SO3 in the catalytic beds and if in large quantity usually will only condense in cold areas of cold heat exchanger tube side (c) and the economiser 2 drain (i).
A BFW leak from the economiser 2 will cause rapid moisture ingress in the gas going into the. A small leak will still not result in any condensate as the gas going to the intermediate absorption tower still has a temperature of 160-180°C and will be in the vapour state. However, as the leak progresses, the dew point increases and the economiser 2 drain will start showing condensate. In severe cases, i.e., with significant water leakage from the waste heat boiler or superheater, condensate can also be found on the cold reheat exchanger tube side.
The effect of a leakage from economiser 1 (h) is similar to economiser 2. However, a leak in economiser 1 will also contribute to a plume in the stack (g), as the mist formed in the final absorption tower will overload the candles and escape to the stack.
The ingress of water/steam to towers will generate great deal of mist which can lead to a rise in candle filter pressure drop and start affecting the dilution water quantity depending on the gravity of the leakage.
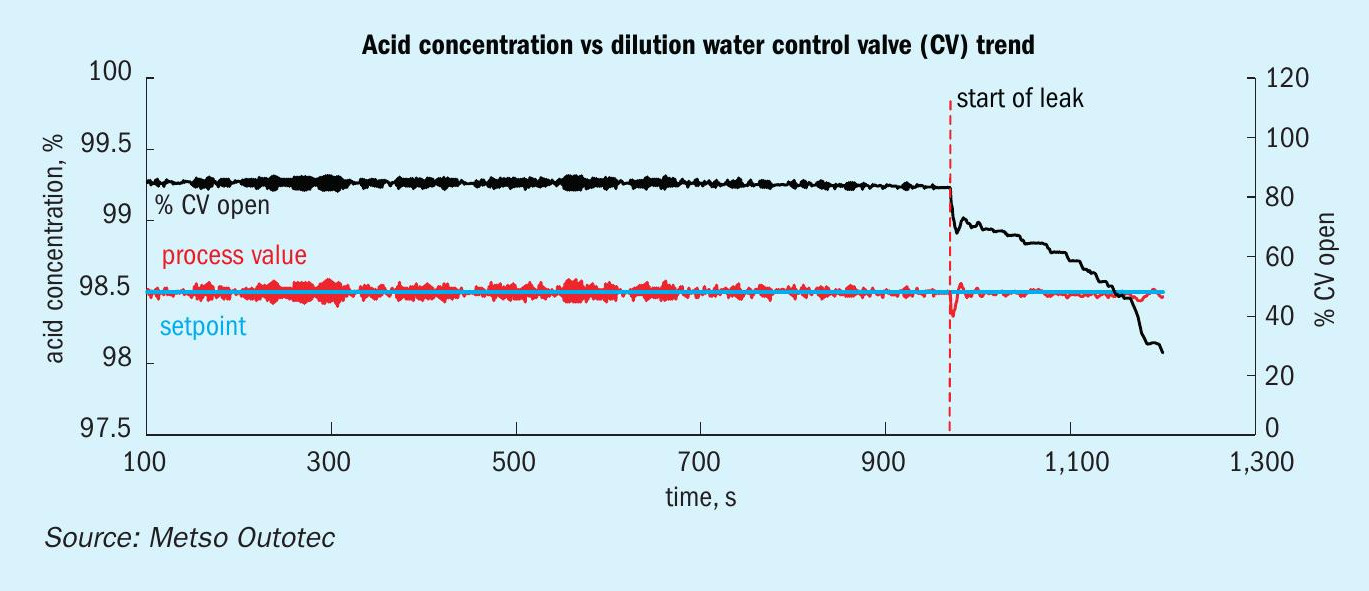
The leak will slowly decrease the dilution water quantity in the acid section (Fig. 11), but a small leak is generally hard to detect and only becomes evident when the leak becomes large enough. This can take a significant time, up to several days, when continuously increasing amounts of condensate can build up. There may also be an increase in the candle filter pressure drop in the IAT/FAT as the moisture ingress in the gas will lead to substantial mist formation in the towers.
For this reason, dilution water quantity flow and control valve opening should be regularly monitored as this usually can be assumed as a constant for a given production and air flow. Any sudden change in the control valve position and water flow should be investigated.
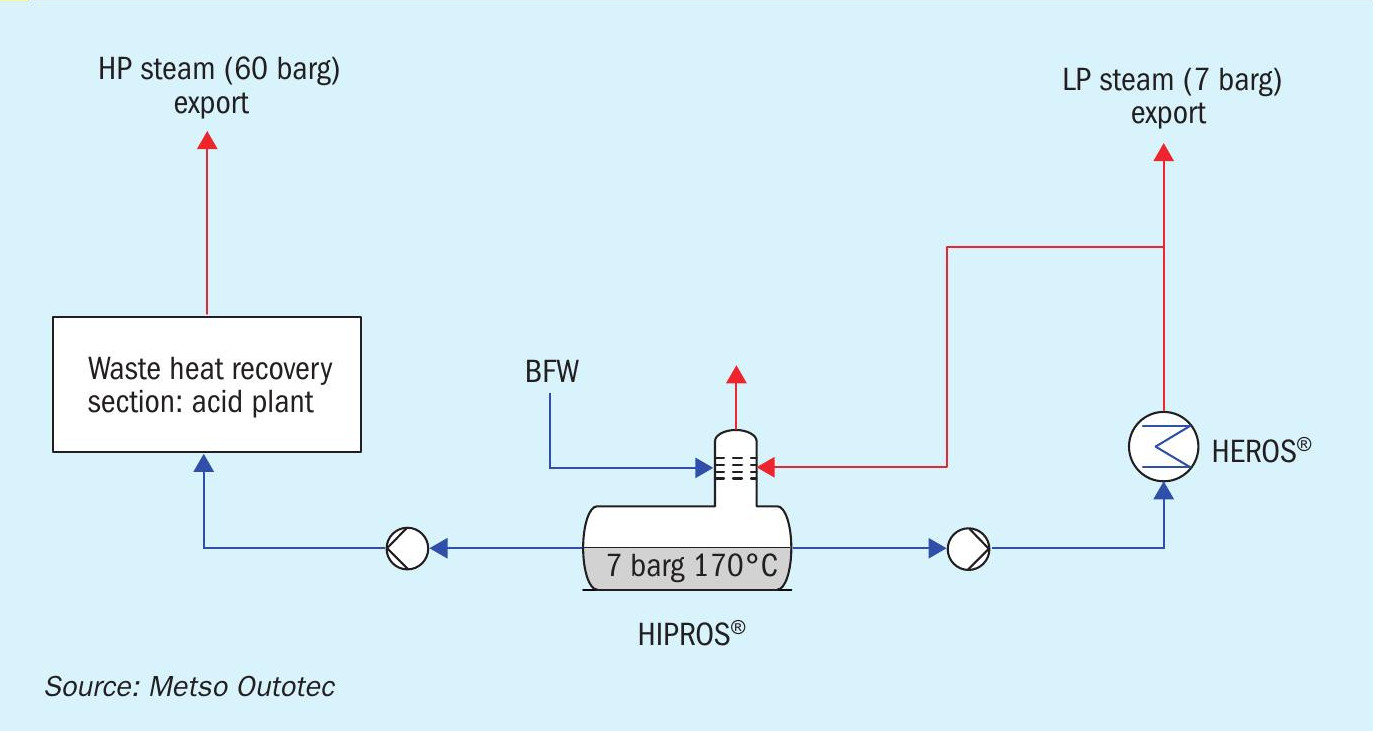
Metso Outotec’s new HIPROS™ design overcomes the problem of low temperature BFW entering the economisers, thus eliminating dew point problems and corrosion in the economisers. The deaerator in the HIPROS™ design is pressurised to 9-10 bar and the BFW temperature is about 180°C entering the economisers, instead of the typical 105°C. This ensures a wide temperature margin between the tube wall temperature and typical gas dewpoint. This higher temperature also leads to higher high pressure steam generation (around 11% increase over conventional design).
Intermediate absorption tower (3)
The same reasons and detection methods apply as discussed in the metallurgical acid plant section.
Final absorption tower (4)
The same reasons and detection methods apply as discussed in the metallurgical acid plant section.
How much condensate is normal?
As discussed in the previous sections the sources of condensate are numerous, especially in a sulphur burning acid plant. It is very important to have a detailed log of condensate at various points of the plant. These should preferably be tabled in the plant logbook as it is as important as other process values. A good log history will allow the operator to compare the results of normal plant operation with abnormal operation and to assess the gravity of the problem.
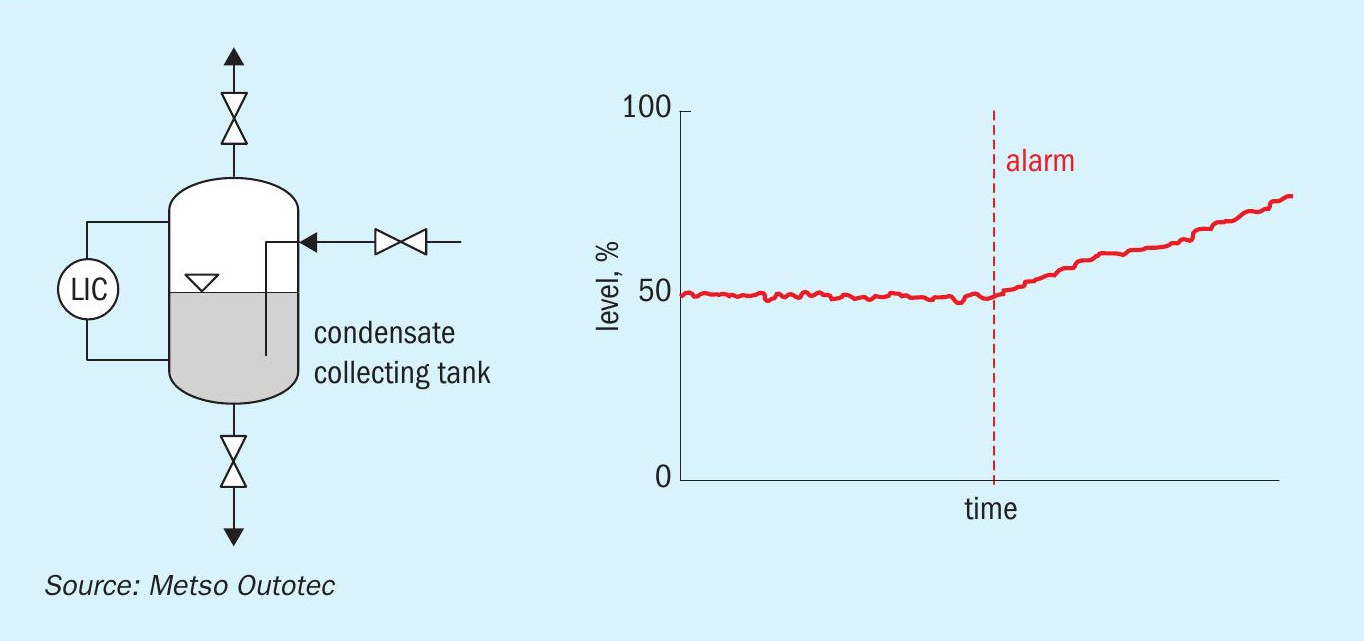
Periodic laboratory analysis of condensate will also give valuable insights of the equipment conditions and corrosion rates. A milky condensate indicates sulphates, a greenish or blueish colour usually indicates a high chromium or nickel content. The metal content can provide an indication of the severity of corrosion rates if the condensate is analysed frequently. In the modern world of digitalisation, it is possible to monitor the condensate generation in various points of the plant by using simple instrumentation loops. One such concept is shown in Fig. 13.
The condensate is collected in the container and the level is monitored by a level transmitter.
The rate of condensate formation is related as a function of level increase vs time. Any increase in the rate will signal an alarm and the operator can check and eliminate various reasons as discussed earlier.
If applied to all the condensate points identified in this discussion, this concept will require a few more instruments in the plant. Also, the instrument ports will require some maintenance and cleaning as the condensate may also cause acid sludge build-up and can easily block the instruments if left unattended.
The question to ask is whether to ignore condensate monitoring be it manual or by digital methods and to pay the price in corrosion, equipment replacement and downtime or to carryout regular monitoring and maintain accurate and detailed data about condensate to increase equipment life and avoid downtime.
As for the amount of condensate acceptable at each of the locations discussed above, there is no general rule. This will depend on the plant load and size/capacity of the acid plant. As a general rule of thumb, for a typical 2,000 t/d acid plant, an amount of 0.5-1.0 litre/day of condensate at the coldest spots (cold heat exchanger, cold reheat exchanger, economiser) would present an acceptable normal quantity.