Sulphur 413 Jul-Aug 2024
31 July 2024
Digitalised sulphur recovery plants for greater plant efficiency
DIGITAL TECHNOLOGIES
Digitalised sulphur recovery plants for greater plant efficiency
The pursuit of operational excellence requires continuous process monitoring, together with qualified analysis of the collected data. The Digital Process Monitor (DPM) provides a process digital twin which consists of an accurate process plant model that incorporates the licensor’s knowledge and expertise in sulphur recovery technology, thereby providing continuous insights into plant performance. This article provides an overview of the DPM features focusing on the related benefits in terms of overall operational improvements and plant efficiency for the sulphur recovery unit.
The digital economy is becoming a major focus for many businesses, from conventional hydrocarbon processing to the domain of green chemistry.
Operating a sulphur recovery unit (SRU) is always challenging, and good management translates into improved safety and reliability. But sometimes operators can be unaware, and this becomes a critical factor potentially leading to loss of production, equipment damage and tarnished reputation; therefore, by adopting digital tools and properly incorporating the know-how of the licensors, this pain point can be resolved as well as reducing plant operating expenses (opex) by increasing margins for the plant owner.
In addition, the contribution of digital tools in assisting opex reduction means that the initial investment required for their implementation, as well as the recurring annual cost to maintain them, can be recouped within the first year of operation. Therefore, a payback time of less than one year implies that the annual opex savings are ongoing benefits that are unlocked over time by digital technologies for the plant owner.
The Digital Process Monitor (DPM)
DPM architecture overview
The DPM is a cloud-based solution co-developed by a series of MAIRE group’s companies, specifically NextChem, Stamicarbon, Tecnimont, and KT-Kinetics Technology affiliates of MAIRE group.
MAIRE is a leading technology and engineering group that develops and implements innovative solutions to enable the energy transition. Through its subsidiaries, the group offers sustainable technology solutions and integrated E&C solutions in nitrogen fertilizers, hydrogen, circular carbon, fuels, chemicals, and polymers.
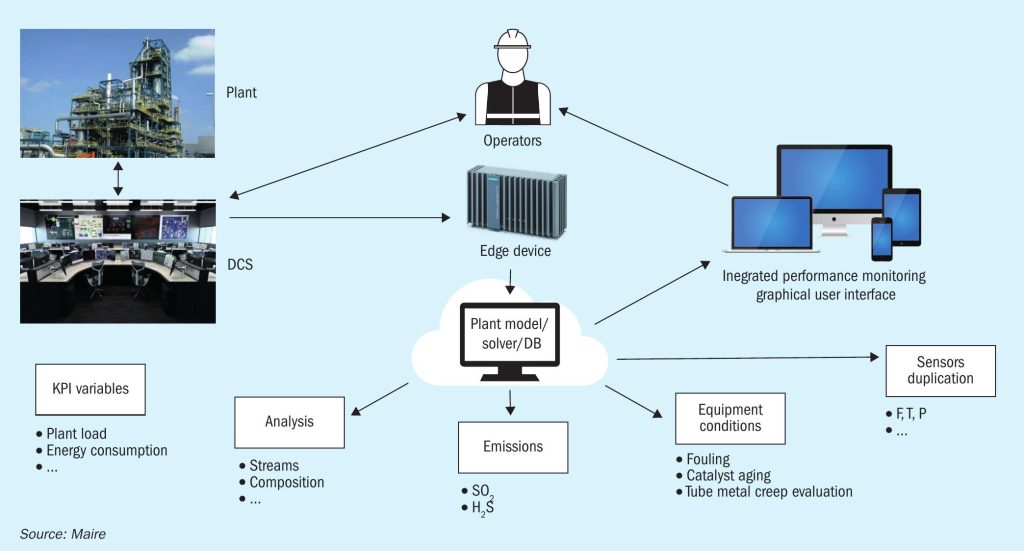
The DPM is based on a first-principles plant model where all of the most important phenomena are rigorously simulated leveraging on unique knowhow as licensor, thereby guaranteeing the highest level of accuracy and adherence between the model response and the behaviour actually observed in reality.
The model is fed with data derived from the plant’s distributed control system (DCS) through a unidirectional data flow. The plant model unlocks valuable information that a DCS alone cannot provide, and with both automated procedures and the licensor’s intervention, it can formulate recommendations for board operators and send them through dedicated user interfaces to enhance the plant’s performance.
It will then be the board operations’ duty to implement the recommendations provided by the licensor through the DPM, by modifying process variables through the DCS to effectively enhance performance improvements.
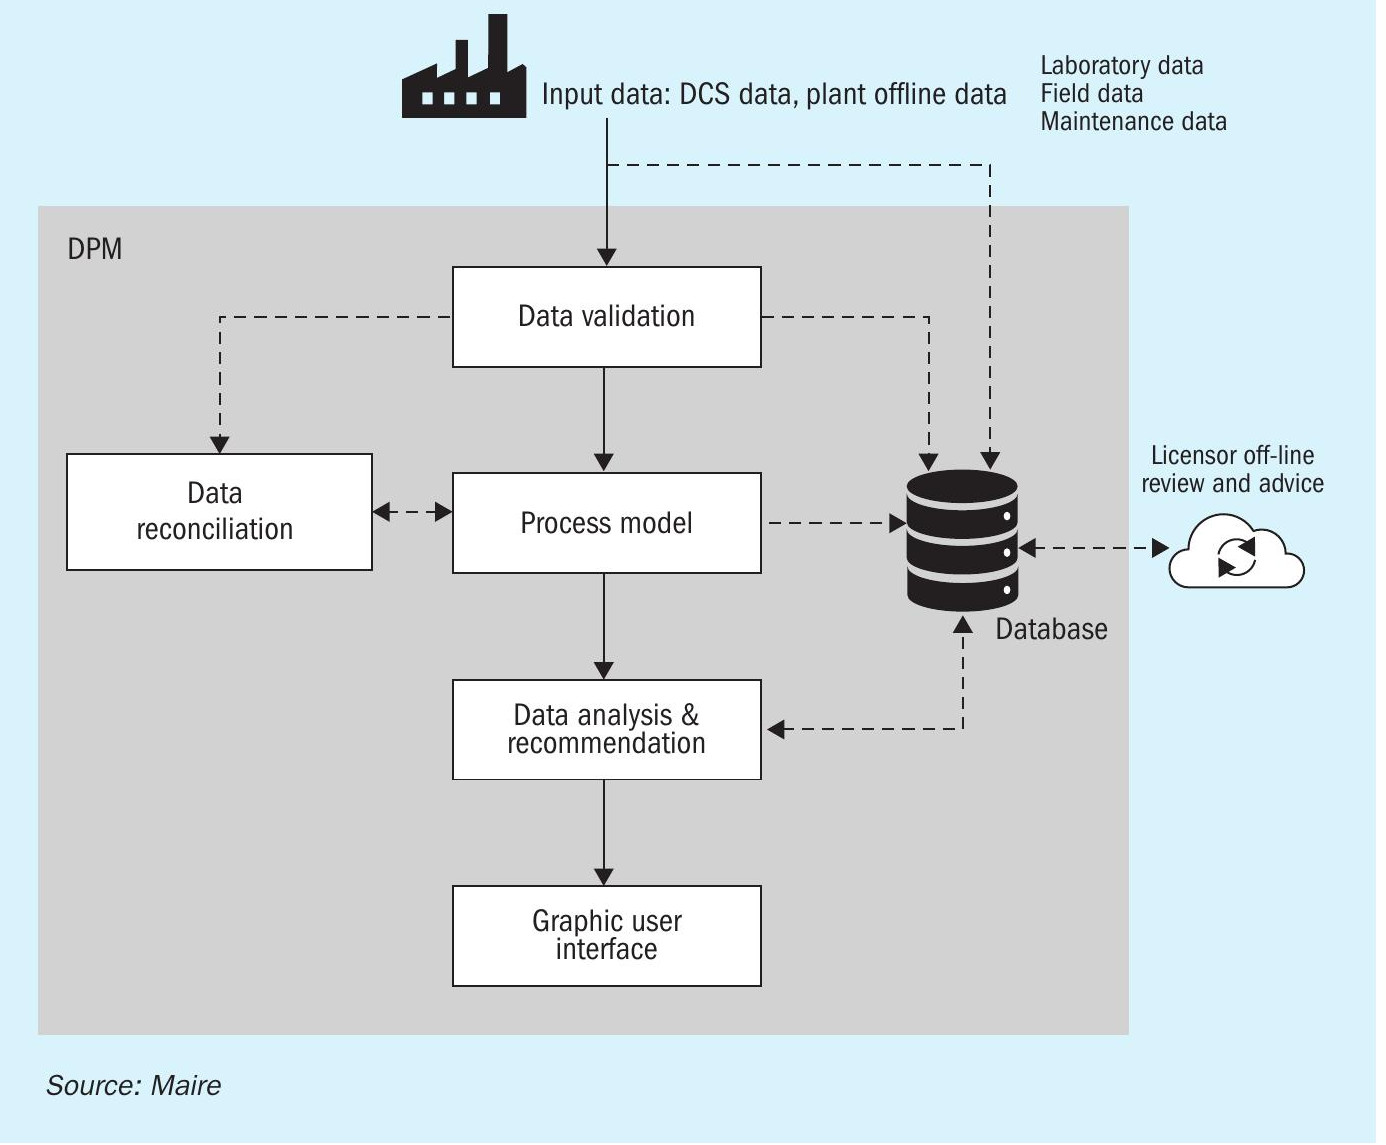
DPM data flow
Input data (online data from the plant’s DCS and offline data derived by measurement campaigns) are acquired by the DPM. A data validation algorithm verifies the quality of raw input data and excludes unreliable ones. Validated data then feed the process model by generating simulated data and soft sensors, which consist of new process variables calculated starting from the DCS data that has been properly manipulated.
The quality of online measured operational data has been addressed by introducing a data reconciliation algorithm to resolve data inconsistencies and improve data reliability.

Following reconciliation, data analysis takes place by leveraging on the comparison between process validated data derived from the DCS and reconciled process data calculated by the process model itself; the tool, with the support of licensor specialists, is capable of generating advice to correctly operate the plant as near as possible to the optimum design conditions.
Fig. 2 represents a schematic architecture of the DPM dataflow as implemented in the software.
Licensor modelling
As already stated, the DPM leverages on a digital replica of the SRU using a simulation engine.
The licensor is the most expert modeller of its own licensed technologies due to the combination of a strong theoretical knowledge and operating SRU feedback.
In addition, licensor’s models include special unit operation blocks for proprietary equipment, customised for licensor design and not available in commercial simulation packages. These customised blocks include the:
- thermal reactor (including NH3 destruction models);
- Claus waste heat boiler;
- sulphur condensers.
In this way proprietary equipment is precisely reproduced in the digital replica by leveraging on the licensor’s consolidated thermodynamic models, providing the most reliable prediction of the SRU’s behaviour.
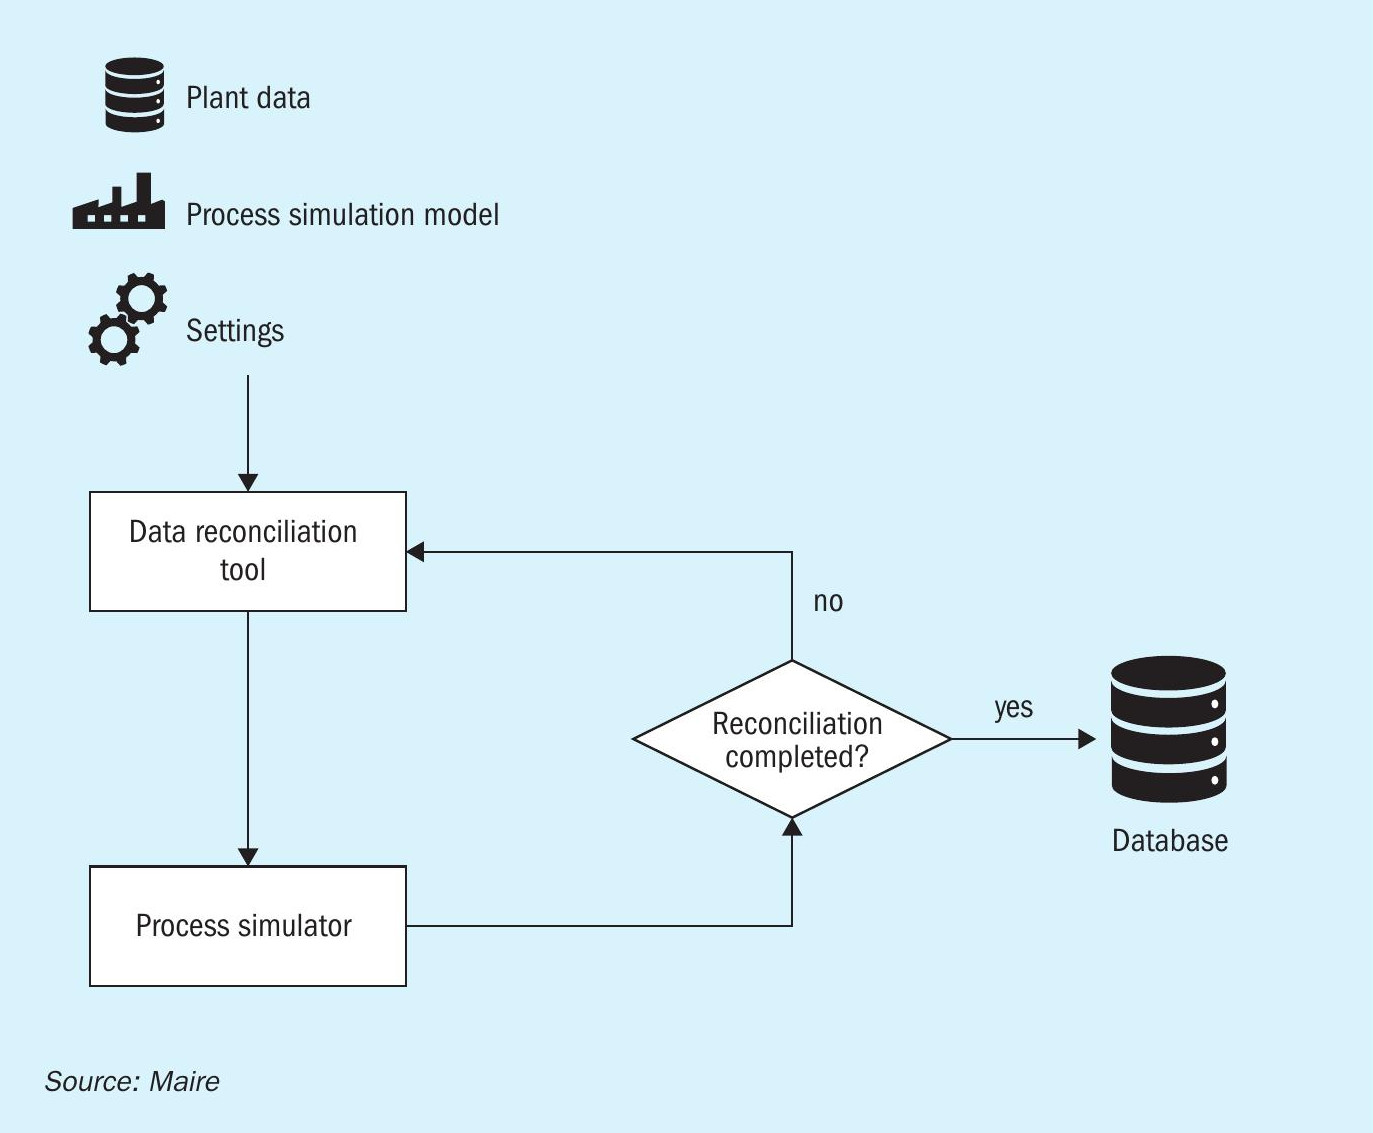
Data reconciliation
Data reconciliation resolves the possible inconsistency of field data, providing an automatic solution to a problem that until now has been solved manually by the licensor’s engineers.
Normally, the quality of online measured operational data is not satisfactory for the evaluation of the plant’s performance, because they are never error free, and even careful installation and maintenance of the hardware cannot fully eliminate this problem. In fact, after collection of plant data, engineers always conduct an analysis to make raw data consistent (for example, from a heat and material balance perspective) so they can conduct a reliable assessment of plant behaviour.
Data reconciliation is a data preprocessing technique which can improve the accuracy of measured data through process modelling and optimisation, identifying potential anomalies in the input data. In other words, licensor data analysis is provided to the plant owner as a ready-touse tool.
On the theoretical side, data reconciliation is summarised as a general optimisation problem, solving an objective function. The objective function is a weighted sum of the relative differences between selected reconciled process data and the corresponding DCS process measured data as indicated by the formula shown below (equation 1):
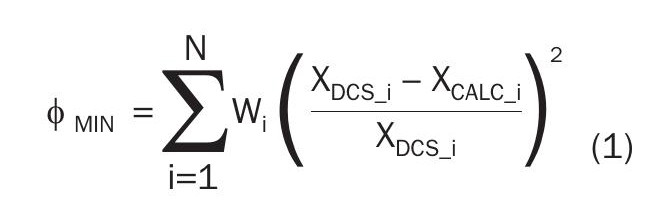
Where:
N = number of variables selected for the objective function
XDCS = DCS data (measured validated data)
XCALC = data reconciled calculated by process simulator
Wi = weight factor chosen by the licensor to reflect the importance of each process data considered in the objective function.
Minimisation of the objective function is done by manipulating some of the variables involved in the reconciliation (typically coinciding with the process data controlled by the DCS). The choice of the manipulated variables, among all the DCS recorded data, is made by the licensor. The variables are manipulated inside a certain interval (standard deviation) which is also implemented by licensor according to the type of process data. The mathematical problem is solved through the Bobyqa algorithm, which consists of a variation of the Powell method for finding a local minimum of a function.
The numerical solver is independent of the simulation engine used, meaning that the tool can even eventually be used for the reconciliation of the processes with different proprietary sulphur recovery technology. A schematic representation of the reconciliation data flow is reported in Fig. 3.
DPM dashboard
The DPM dashboards are the main graphic user interface and are designed by the licensor to provide operators with a quick and comprehensive overview of plant behaviour. Literally, DPM dashboards provide plant owners with a handy overview of plant operation in their pocket at all times: dashboards are designed to be visible on multiple devices such as laptops, tablets, or smartphones. Data reported on dashboards are not only DCS data, but also helpful operating parameters (soft sensors) that cannot be derived directly from the DCS but are continuously calculated by the DPM model. Traditionally, these key parameters have not been available to operators for their immediate use, as they derive from an analysis of DCS data which can take hours to days, delaying any necessary remedial action. The DPM’s goal is to automatise this process, creating a live report of plant operation, minimising the time between diagnosis and remedies in the event of an upset or deviation from optimum running conditions.
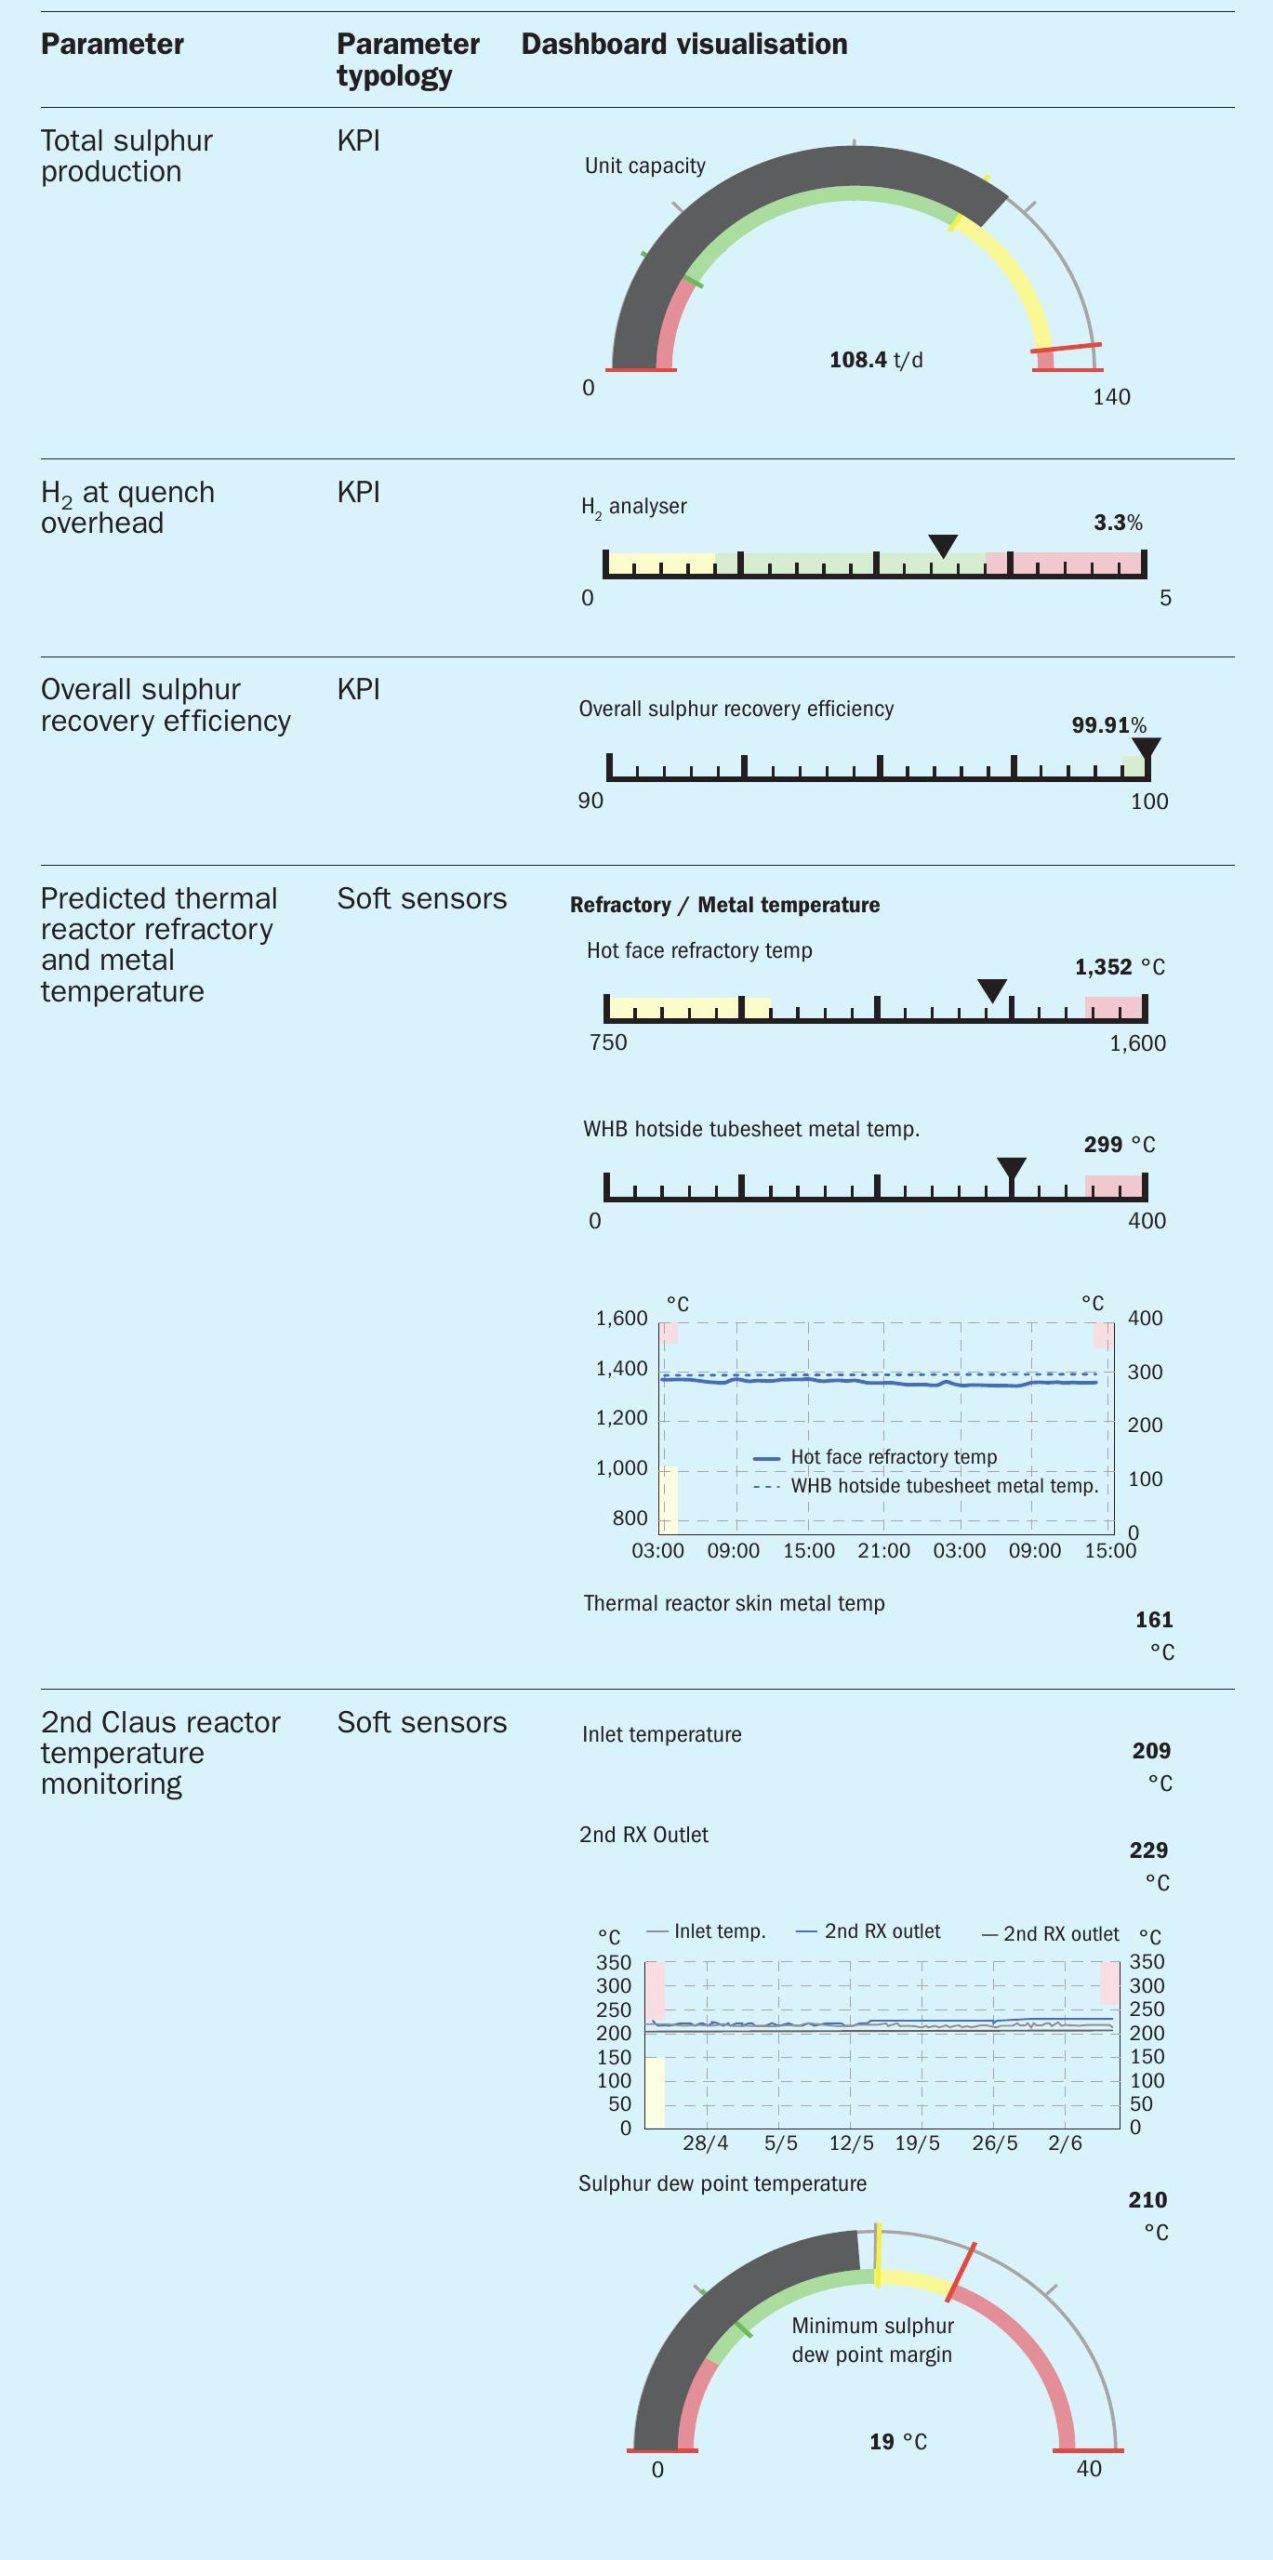
The content of dashboards is intended to be customised by the licensor to fit with specific requirements of plant owners. However, in principle, dashboards are designed to be composed of multiple sections:
- a main board giving an overview of plant operation / production, showing feedstock and product quantity and quality;
- dedicated boards for each plant section, showing the main operating parameters and the key factors that will be closely monitored;
- dedicated boards resuming KPI of the plant and showing possible savings.
Case study of a sulphur recovery unit
Methodology
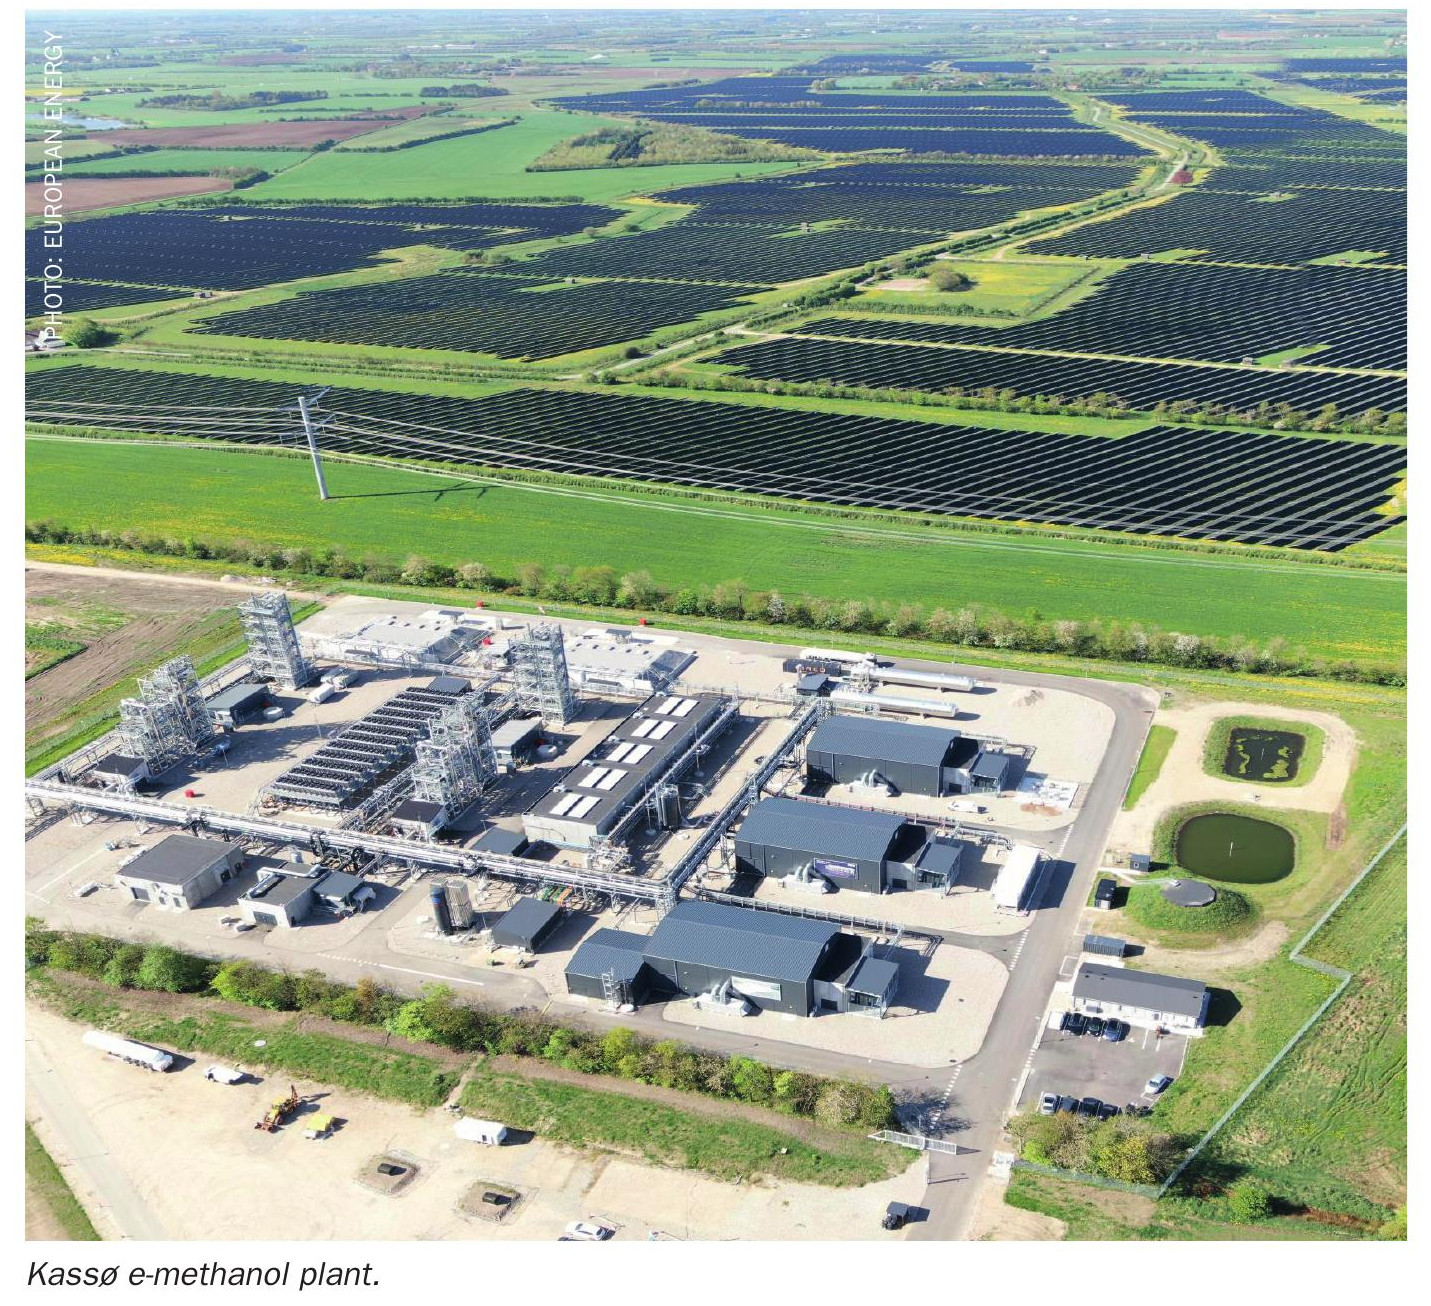
A case study has been conducted on an existing SRU with a capacity of 190 t/d of recovered sulphur located in Europe. The SRU is composed of:
- two identical Claus trains;
- one TGT train with an external amine regeneration unit;
- one incinerator section equipped with waste heat recovery composed of steam production and steam superheating.
Amine regeneration, being part of another unit, was not considered part of the case study.
A whole year set of hourly plant DCS data was made available by the plant. Starting from raw data, a data selection was performed to identify the following representative cases:
- plant fully aligned (2 Claus trains + TGTU + incinerator);
- stack emissions not out of spec.;
- steam superheater online.
The selected set of data were averaged monthly. The following KPIs were chosen to identify a representative case for each month:
- fuel gas consumption at incinerator;
- hydrogen measured at quench tower outlet;
- Claus efficiency.
The timestamp which represented the closer scenario to the average one based on the KPIs listed above was chosen as representative case for the month.
All representative cases were then reconciled to minimise the errors of DCS data, thus becoming the benchmark for the optimisation study.
Opex saving estimation
For each month, a representative case was optimised by the licensor within the SRU digital replica according to the following criteria:
- temperature of incinerator chamber equal to 630°C, minimum for achievement of target emissions;
- hydrogen at quench tower top lowered at 3.5 vol-%, which is an acceptable value for complete conversion of sulphur compounds in the hydrogenation reactor;
- second Claus reactor inlet gas temperature of 200°C, which was found compatible with the sulphur dew point of the tail gas predicted by the DPM;
- hydrogenation reactor inlet temperature of 220°C minimum, which is an acceptable inlet temperature for a low temperature hydrogenation catalyst.
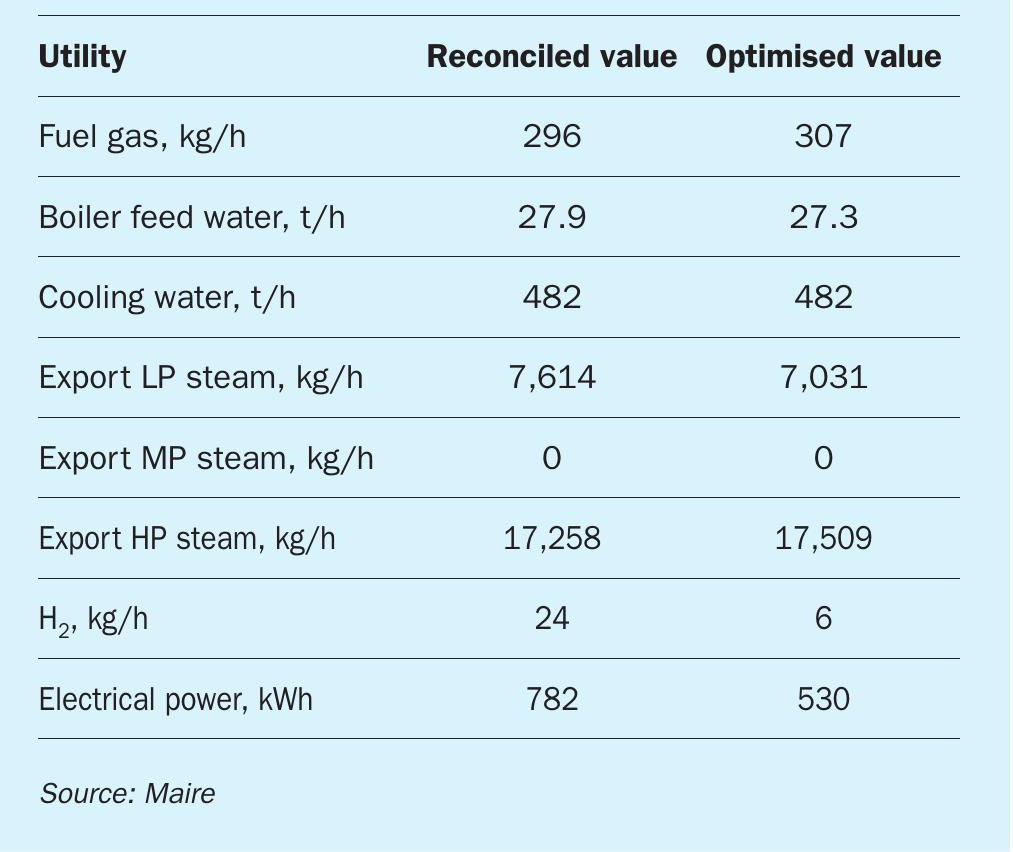
All the benchmarks and the optimised cases were averaged to create an average utility consumption summary, in order to evaluate eventual savings in terms of opex. The utility consumption of the averaged benchmark and optimised cases are reported in Table 2.
The utility costs used in the case study are summarised in Table 3.
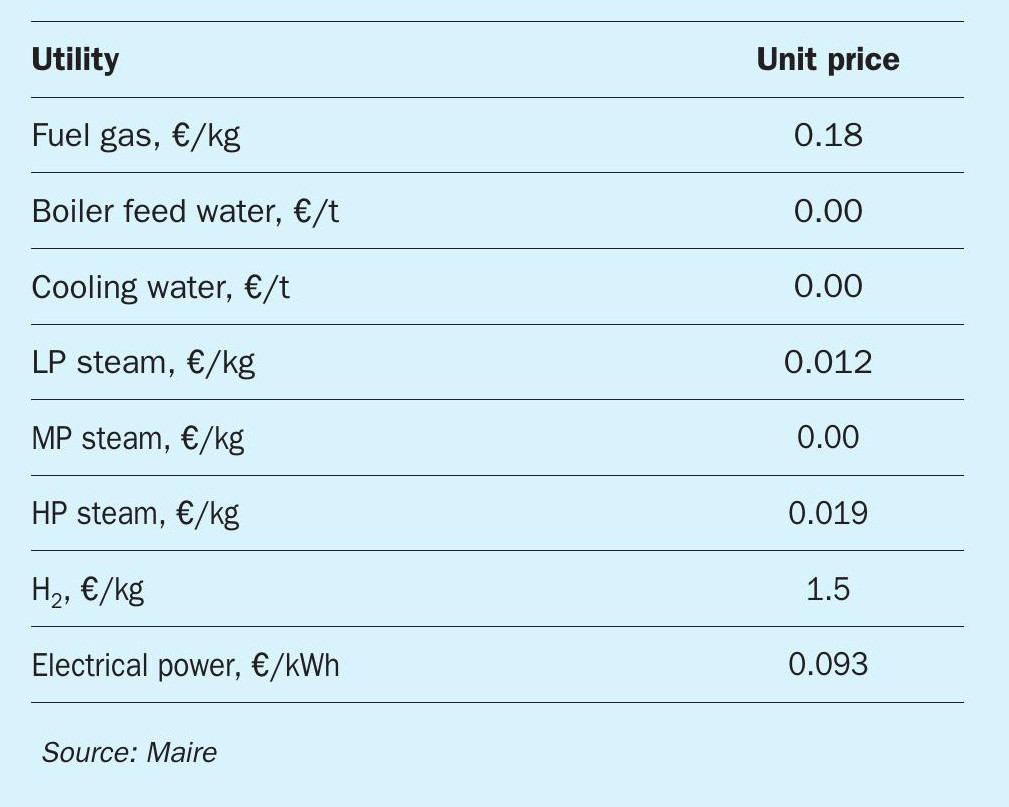
The opex savings evaluation was based upon 8,600 hours of plant operation per year.
The results of the case study led to an estimated saving on opex of up to EUR 385,000 per year by implementing the synergy obtainable from the DPM and licensor optimisation.
Carbon footprint reduction
The DPM also contributes to reducing the carbon footprint of SRUs since it allows optimisation of:
- the consumption of fuel gas and hydrogen;
- the consumption of electricity;
- the steam exported at various pressure levels.
Using the case study above, the carbon footprint reduction was calculated according to the following criteria and reasonable simplifications:
- 8,600 yearly operating hours
- the carbon footprint is calculated by assigning equivalent emissions factors only for the electricity and fuel consumptions, having all the other utilities optimised a negligible impact on the CO2 equivalent emission
- the following CO2 equivalent emission factors are derived from “2BS-PRO-03 – Methodology for the calculation of GHG emissions – version 1.9”:
-
- 127.65 gCO2eq /MJ for electricity;
- 67.59 gCO2eq /MJ for natural gas and fuel gas.
-
The results of the case study led to ~18% reduction of GHG emissions equivalent to 2,300 t/y of CO2eq. Considering a hypothetical carbon tax of EUR 30 per ton, savings add up to EUR 69,000 per year.
Conclusions
Using the DPM unlocks several advantages as far as reliability and improved plant operation are concerned.
Continuous monitoring gives an improved overview of several features for SRU plants, including:
- critical transient events;
- combustion anomalies;
- hydraulic profile;
- soft sensors representing unmeasured values.
Both short and long-term benefits from using the DPM have been identified. Examples of short-term benefits are:
- identification and analysis of critical operation, avoiding prolonging such operation and preventing possible mechanical damage, excessive utility consumption and minimising environmental impact;
- the monitoring of combustion anomalies, maximising the prevention of undesired breach of emission limits or potential contaminants breakthrough, such as ammonia from the Claus thermal reactor;
- guidance for field instruments recalibration thanks to DPM outcomes improving overall plant reliability.
Long term benefits are listed below:
- monitoring of the catalyst behaviour, helping to reach an optimised catalyst operation, leading to improved performance, lower polluting emissions, early detection of poisoning and catalyst ageing with consequent extension of catalyst life and opex savings;
- monitoring of hydraulic profile, providing an early diagnosis of any fouling or soot deposition happening in the plant, thus preventing plant operation disruption due to high pressure losses, or allowing a more optimised planning of turnarounds.
The above lists provide examples of just some of the numerous benefits which a more digitally enhanced approach can bring to the energy sector. As is well known, the energy sector is a very conservative business segment, but today there are two game-changers that can dramatically accelerate the changes already occurring in adjacent sectors such as insurance, banking, retail, etc.
Digital transformation and the energy transition are two sides of the same coin, because the goal of decarbonising existing and new industrial complexes can be effectively achieved only by leveraging on digitalisation.
Going forward, MAIRE will continue to develop and improve its newly created tools, which are part of MAIRE’s NextPlant digital platform, for managing the operational challenges in low carbon chemistry and the hydrocarbon processing arena.