Nitrogen+Syngas 366 Jul-Aug 2020

31 July 2020
Agricultural demand for nitrogen
AGRICULTURE
Agricultural demand for nitrogen
Agricultural markets represent 75% of nitrogen demand worldwide. Rising populations, changing crop types, moves towards sustainability and the spread of speciality fertilizers and new technologies are all changing the market for nitrogen fertilizers, but the Covid pandemic may affect markets in a variety of different ways.

Nitrogen remains the key nutrient for plant development. It is the fourth most abundant element present in plant tissues, after carbon, hydrogen and oxygen, but unlike them, cannot be sourced from air and water, as atmospheric nitrogen is too tightly bound to itself in an N2 molecule. Outside of legume crops, which have root bacteria that can convert N2 into soil nitrate, most crops can only take up nitrogen in the form of NH4 + and NO3 _ , mainly the latter. Due to the limited amount of nitrogen available in soils, it usually remains the key determinant of plant growth throughout the plant’s life cycle. This is especially true of cereal crops, which are the staple of the world’s food supply, which tend to require higher than average applications of nitrogen.
While there is extensive use of manures and there has been some research into allowing non-legume plants to use nitrifying root bacteria in the same way, for the moment artificial nitrogen fertilizer produced via the Haber-Bosch ammonia process and downstream processing into urea, ammonium nitrate and NPK blends remains the main source of agricultural nitrogen worldwide.
Unlike potassium and phosphorus, the other two major plant nutrient requirements apart from nitrogen, nitrogen must be applied annually for plants to receive its benefit. Yara calculates that after one year without nitrogen application, soil fertilizer and productivity declines by 45%, and after two years the fall is 80%. This means that agricultural demand for nitrogen tends to remains relatively predictable and steady. Last year, about 75% of all ammonia produced around the world was consumed either in downstream fertilizer production, or directly as an agricultural nutrient (US farmers in particular use ammonia solutions sprayed directly onto fields as a fertilizer).
Factors affecting demand
On a long-term basis, two major factors have underpinned the growth in nitrogen demand – global population increase and increasing global incomes. Undoubtedly the most influential aspect over the past 50 years has been the rapid rise in population. The world’s population stood at about 3 billion in 1960, 4 billion in 1975, 5 billion in 1987, 6 billion in 1999 and 7 billion in 2011 – in theory, doubling the number of people should double demand for food. This is not the factor it once was; as incomes have risen so fertility rates have fallen, assisted in China by the ‘one child’ policy which began in 1980. The annual increase in the world’s population reached a maximum in 1987, and since then has fallen, albeit slowly, and is projected to begin falling faster over the next few decades – it is currently increasing at an average of 1% per year, but in some regions, especially Europe, Japan and Russia, total population levels are falling. Asia’s population is expected to peak in the next couple of decades, and only Africa is still seeing considerable population growth.


The other major driver of fertilizer demand growth over the past few decades has been rising incomes in the developing world. As farmers’ incomes increase they are able to afford more fertilizer, and as the overall population’s income increases people begin to include more meat in their diet, which in turn requires more land given over to raising crops to feed animals, and hence more fertilizer. Figure 1 shows global nitrogen fertilizer demand growth (in blue) on the left hand axis, and global GDP/capita (in inflation-adjusted dollars) on the right. Using GDP per capita strips out the effect of rising population, and shows that while fertilizer demand growth outpaced growth in global incomes during the 1960s and 70s (when the increase in fertilizer use was dominated by rapidly increasing population), from about 1980 onwards demand growth has been led by rising global incomes.
This means that food demand is projected to continue over and above the rate of increase of population, and with it demand for fertilizer – other ways of increasing food production, such as increasing area under cultivation appear not to have had an effect in practice. The amount of arable land under cultivation increased from just under 1.4 billion hectares in the 1960s to about 1.5 billion hectares in 1990, but has stayed relatively constant at that level ever since, as EU measures to take lands out of cultivation and increasing urban sprawl in Asia have been equalled by new regions being cultivated, eg in Brazil.
Negative factors
In tandem with long-term positive factors for agricultural demand, there are factors affecting demand in a negative way. The main one is increasing nutrient use efficiency. Nitrogen fertilizer application per hectare varies from around 110-180 kgN/ ha for most of the world to as low as 20 kgN/ha for Africa. Where fertilizer is over-applied or applied at the wrong season, in excess it can leach into watercourses and cause algal blooms and anoxia in water. This became such an issue in Europe during the 1980s that a conscious effort was made to apply less nitrogen and phosphorus and to better target fertilizer application to minimise run-off. The success of this policy has led to Europe’s steady lowering of nitrogen consumption, and other countries are gradually following suit. Imbalanced fertilizer application can also be an issue, as occurs in India. Figure 2 shows fertilizer application and yield in a variety of countries. Although India applies as much nitrogen as other countries which achieve better yields, its fertilizer subsidy policy has pushed urea at the expense of other fertilizers, and the lack of P and K means that nitrogen uptake is inefficient.
Government policy is the key determinant for this demand factor, and moves to apply fertilizer more efficiently are likely to see overall demand fall over the longer term. China, which applies over 300 kg nutrient per hectare, has tried to cap demand for fertilizer at 2020 levels, and thereafter decrease it by instead applying fertilizer in a more targeted manner. As China represents 35% of global fertilizer consumption, this is a significant straw in the wind. Overall, IFA reports that nutrient use efficiency has been rising for three decades following a fall to the end of the 1980s, reaching 59% in 2017 across all regions and nutrients. This averages across 72% for the USA, 80% for Brazil, 62% in Europe, but only 47% in China and 40% in India. Increasing nutrient use efficiency (NUE) in India and China are likely to lead to a relative fall in nitrogen fertilizer demand, or possibly in India’s case a less rapid rise than might otherwise have been expected.
Short term factors
In the short term, agricultural demand for nitrogen is dependent upon crop prices, especially nitrogen-hungry cereal crops, as these are a key determinant of how profitable it will be to grow a given crop this year, and how affordable fertilizer will be for the farmer. Crop prices in turn are a function of relatively constant demand and known stocks of grain set against variable annual yields determined very much by weather patterns. Here the increasing number and severity of extreme weather events that characterise climate change can have a major impact in increasing agricultural market volatility. This year of course, both fertilizer supply and demand (in the sense of whether farmers would be able to import fertilizer) – and hence pricing – have also had the additional complicating factor of the Covid-19 pandemic and associated lockdowns. However, as farms are generally in sparsely populated rural areas where people work outdoors and it is hence easier to maintain a 2m distance from people, and because most governments have designated agriculture as a key national industry, the actual impact of the pandemic has been more muted upon farming activity, and has mainly been on fertilizer supply due to factory and port shutdowns.
The UN Food and Agriculture Organisation (FAO) attempts to provide a regular measure of these important metrics. In its most recent report, published in June 2020, it noted that in spite of uncertainties posed by the pandemic, forecasts for the 2020/21 season indicated a fairly comfortable situation for cereal supply and demand. Relatively mild weather (as compared to, eg the floods that affected North America last year and India’s delayed 2019 monsoon) meant that projections for global cereal production this year are up on 2019’s already record yield by another 2.6%, at 2.78 billion tonnes, 70 million t/a higher than in 2019. Maize accounts for most of the predicted increase, with an expected expansion of 64.5 million t/a to 1.2 billion t/a due to record harvests in the US, Canada and Ukraine, and near-record harvests in Brazil and Argentina. Rice production is forecast to reach 509 million t/a in 2020, up 1.6%. Only global production of wheat is forecast to decline this year, because of downturns in the EU, Ukraine and the US.
Cereal demand is expected to be up 1.6% in 2020-21 to 2.73 billion t/a, with more feed required for animal rearing. This would indicate that inventories would reach a new record of 927 million tonnes, of up 4.5% at the end of the 2020-21 season, a rise in the cereal stock-to-use ratio to 32.9%, far higher than the low of 21.2% in 2007-08. This will generally indicate falling crop prices.
In spite of these projections, worries about supply of grain did lead to some price increases during March and April, taking prices 7% higher than for the comparable period in 2019.
Regional variation
Nutrien have also said that they expected North American nitrogen demand to remain strong through the planting season, and inland nitrogen prices have remained stable. US corn and soybean cash prices have seen a downturn due to demand challenges created by Covid-19 and anticipation of increased supply this year. There is decreased corn use for fuel ethanol production as people stay at home and drive less. However, US government farm support programs are also expected to increase prices by $0.36/bu for corn and $0.45/bu for soybeans. The US Department of Agriculture forecast 97 million acres of corn planting, up 15 million on 2019, and 84 million acres of soybeans, and although Nutrien put these figures closer to 95 million acres and 86 million acres respectively they still represent a 1-3% increase in total crop expenditures.
In Brazil, the soybean harvest is already complete and will produce 121 million tonnes, 4 million t/a higher than for the previous year. Soybean and corn prices are near historical highs in Brazil, which should support a higher soybean acreage in the 2020 planting season.
Australian soil moisture levels have improved significantly after several years of droughts, which also supports the outlook for increase crop input demand in 2020. Strong fertilizer demand is also expected from India.
Fertilizer supply
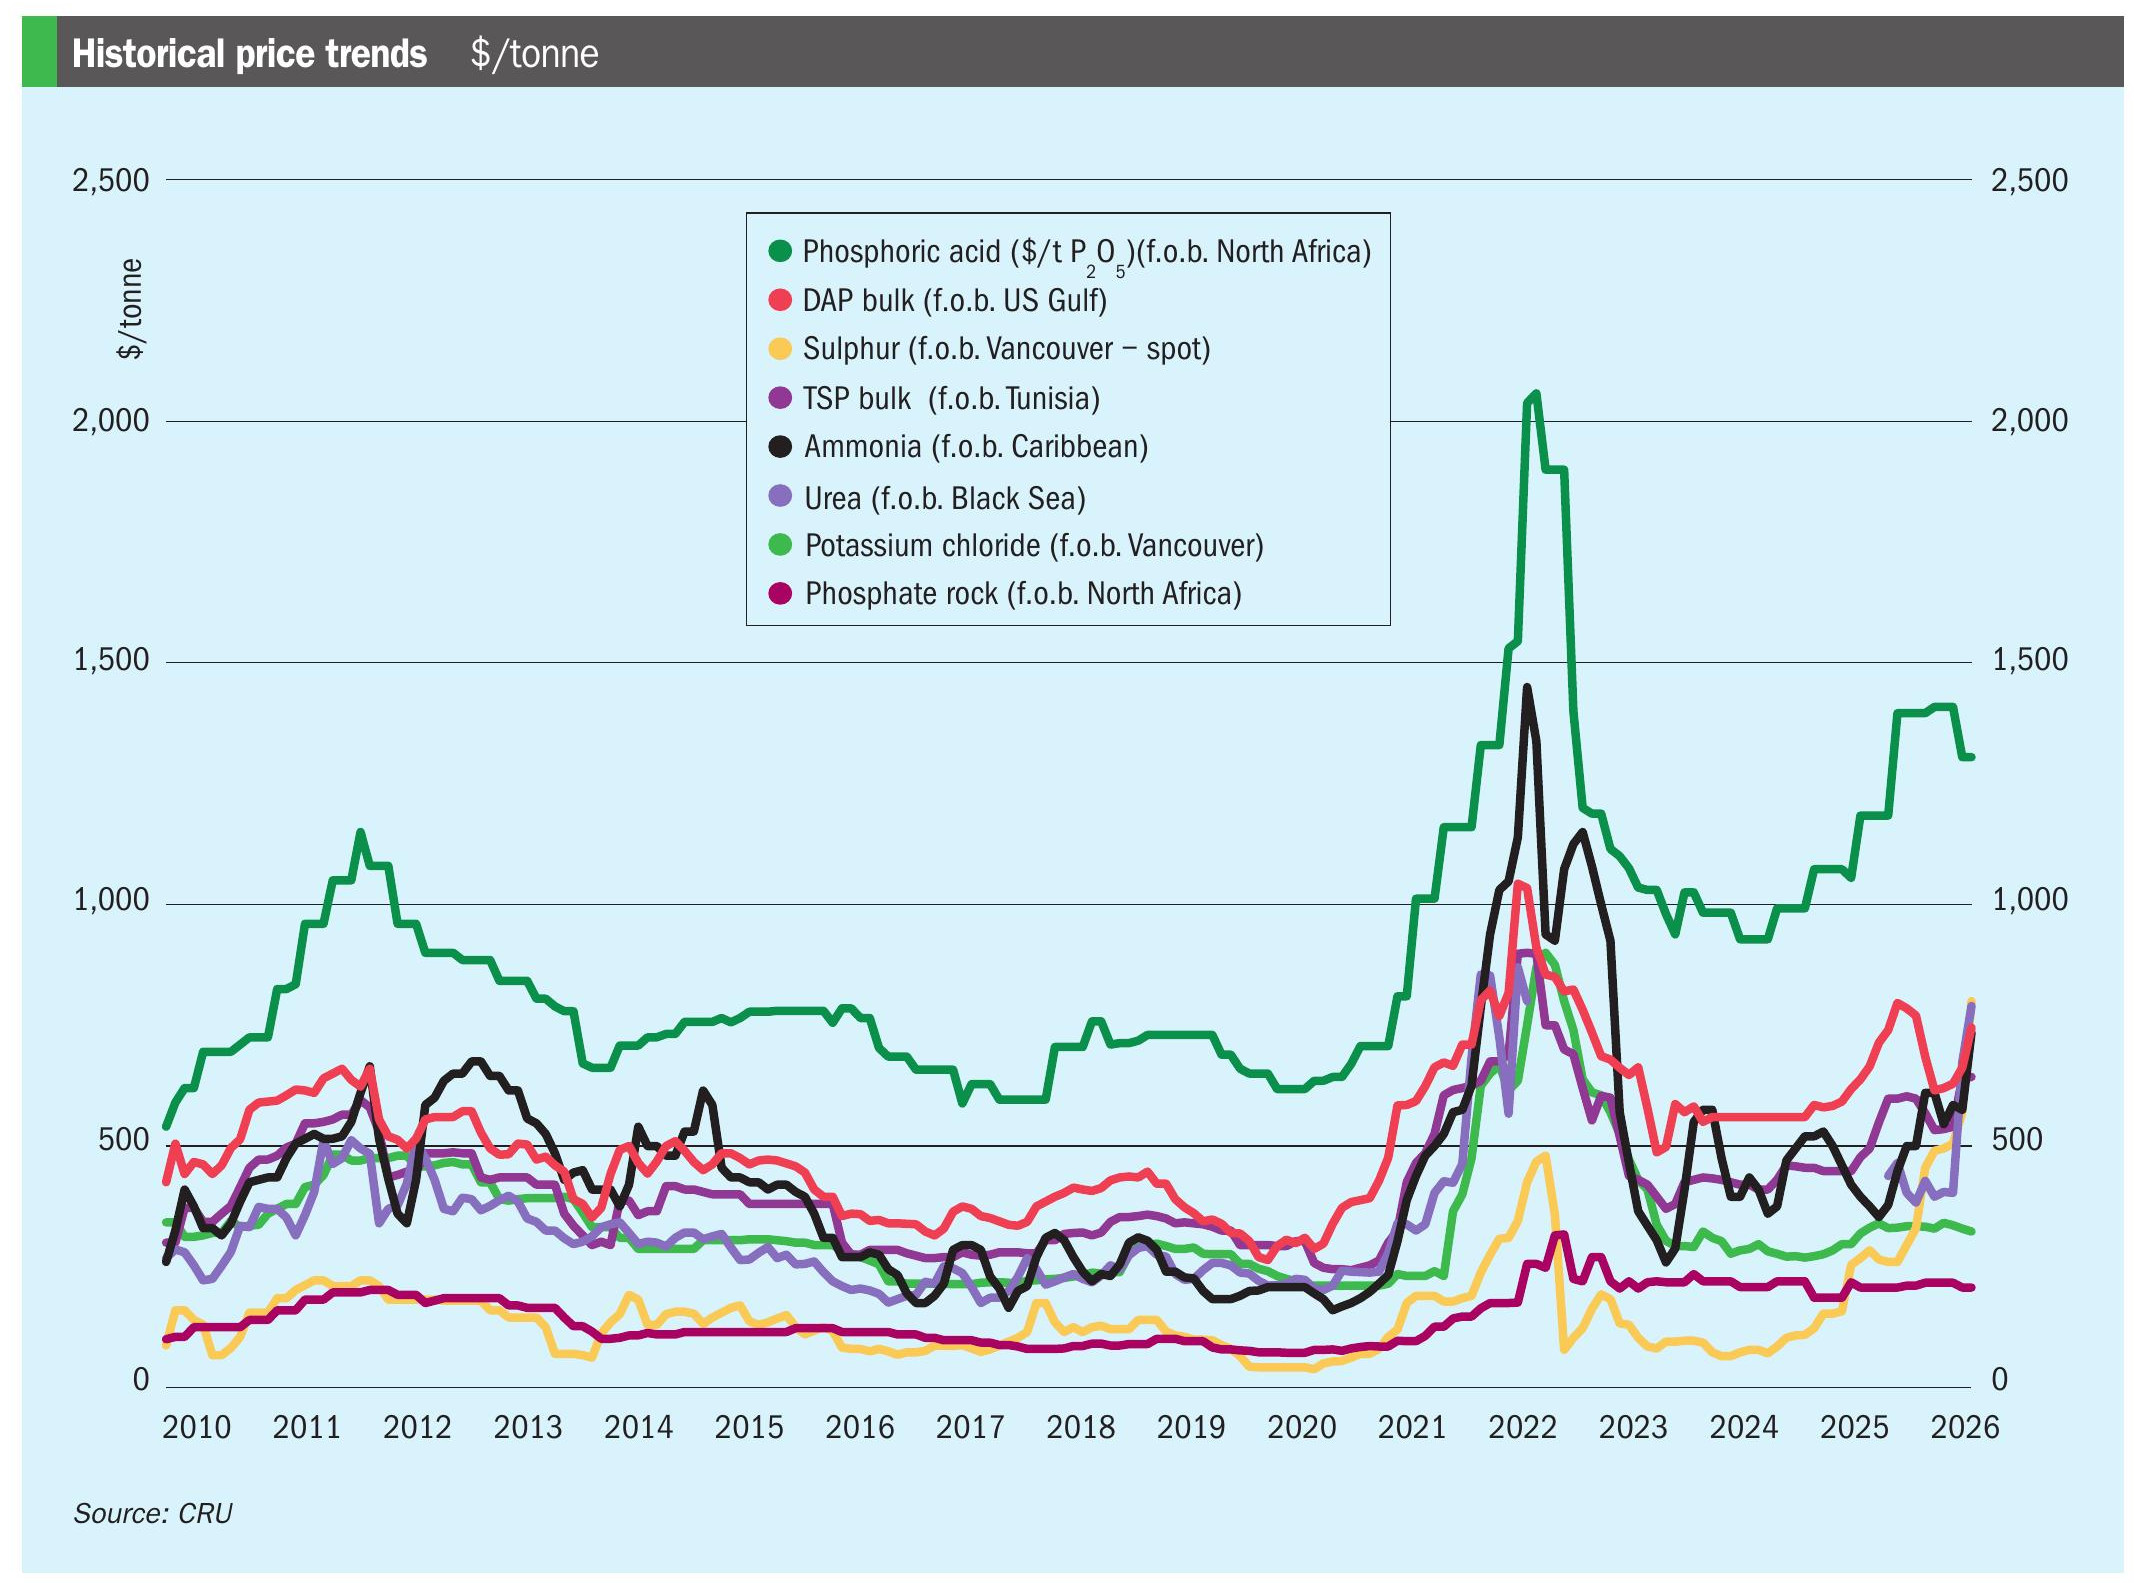
Fertilizer price and affordability to farmers are also a key determinant of short term demand for nitrogen fertilizer. Although the Covid19 pandemic has had an impact on fertilizer production, with urea plants shut across India and China during March and April 2020, urea prices actually fell during 1Q 2020, by an average of 15%, indicating that there was no issue with supply – the industry has been in a state of oversupply for five years as the present round of new investment in production comes on-stream and outpaces the average 1% per annum demand growth. Shutdowns of industrial consumers of nitrogen have meant that a higher proportion of overall production is available for agricultural use. Margins for producers have also been helped by falling natural gas prices, to record low levels in Europe and the US. Overall, fertilizers remain relatively affordable for farmers in the short to medium term, although lack of new production coming on-stream over the next couple of years should see prices start to increase again. The difficulty has mainly been in transportation and logistics, with additional Covid-related checks and port shutdowns causing bottlenecks, but, e.g., although urea exports from China to April, at 786,000 tonnes, were down on 2019’s figure of 1.3 million tonnes for 1Q 2019, they were up on 2018’s low figure of 294,000 tonnes. In their most recent results presentation, Nutrien said that because of limited new export supplies in other markets and reduced Chinese production, they foresaw relatively stable Chinese exports of between 4-5 million t/a in 2020, only slightly below last year’s figure of 4.9 million t/a.
Still, some regions, especially India, South America, Western Europe and Australia, remain more dependent on imported nitrogen fertilizer and hence more vulnerable to disruptions in global trade.
Overall forecast
The impact of the Covid-19 crisis on global agriculture remains a difficult one to assess. Containment and mitigation measures taken by governments to limit the spread of the disease have already led to logistical disruptions while immigration restrictions may affect the availability of seasonal agricultural workers in e.g. Europe and North America. Outside of the immediate impact on this year’s plantings, however, there are longer term worries about the severe economic crisis that several months of lockdown may impose upon global economies. While demand for staple crops tends to be more resilient, it could lead to reduced demand for higher value crops, as well as biofuels such as corn ethanol in North America and sugar ethanol in Brazil, and soybean-derived biodiesel elsewhere. A recession that significantly reduced farm incomes would affect their ability to purchase fertilizers in coming years. In a recent webinar, IFA noted that during the last global recession, caused by the 2008-09 financial crisis, global nitrogen consumption fell by 3% in the immediate aftermath, although it had returned to its pre-crisis figure within two years. Nitrogen in this respect is more resilient than potash and phosphate. Nevertheless, the potential for a similar reduction in 2020 is there. Fertilizers for spring planting seasons in North America and Europe were largely already purchased by March 2020, and Brazil’s fertilizer requirements for soybean planting will not be until September, but the bulk of Asian buying is during the summer months.
Longer term, the impact on nitrogen demand will depend upon global income growth, and that in turn on how severe any economic downtown is.