Nitrogen+Syngas 366 Jul-Aug 2020

31 July 2020
The market for ammonia
AMMONIA
The market for ammonia
Merchant ammonia capacity, only a relatively small 10% of overall ammonia demand, has been expanding in recent years and was already in surplus even before the current Covid crisis, but longer term a shortage of new projects may tighten the market again.

Global production of ammonia continues to rise. As Table 1 shows, in 2018 this reached 178 million t/a in 2018, and IFA estimates are that it rose by another 2.5% in 2019 to 182 million t/a. However, most ammonia is consumed at the point of production, in captive downstream urea, ammonium nitrate, nitric acid and ammonium phosphate production. The merchant market for ammonia totalled 20 million t/a in 2018, about 11% of global production.
While most (75%) ammonia goes towards fertilizer production, particularly urea, this figure is proportionately lower for merchant ammonia production, which is often used by industrial chemical producers for the production of, e.g., caprolactam (for fibre production), acrylonitrile, adipic acid, isocyanates (for polyurethane production), and low density (explosive grade) ammonium nitrate. Of the merchant ammonia that is used for fertilizer production, most goes to ammonium phosphate manufacture, which is centred on regions of phosphate mining like Florida, Morocco, Jordan etc, and which transports more easily portable ammonia for MAP/DAP production. A small amount is imported by urea and ammonium nitrate producers in regions with relatively high domestic gas cost which makes local ammonia production less economic, such as southern Africa.
Merchant ammonia production, conversely, tends to be in low gas cost regions with easy access to ports and overseas shipping. On a regional basis, as shown in Table 1, it can be seen that the major net importing regions continue to be North America (mainly to feed DAP production in Florida), Western Europe (for a variety of uses, often industrial/technical), South Asia (mostly to feed Indian DAP and some urea production) and East Asia (Japan, South Korea, Thailand and Taiwan are all net importers, again often for industrial/technical uses). By nation, the largest importers are India (2.7 million t/a in 2019), the US (2.5 million t/a), Morocco (1.5 million t/a), Korea (1.3 million t/a) and Turkey (1.0 million t/a). On the export side, the major volumes come from Russia (4.6 million t/a in 2019) and Trinidad (4.5 million t/a). The Arabian Gulf states (including Iran) add another 3.0 million t/a to that, and North African countries (mainly Algeria and Egypt) another 1.9 million t/a.
Changing patterns of supply and demand
The largest importers, historically, as they continue to be, are the United States and India. India is building new ammonia capacity, but this is mostly associated with downstream urea capacity, and the impact on imports for Indian DAP production is expected to be fairly small.
However, US imports of ammonia have been on a steady downward trend over the past decade as more domestic capacity is built or re-started. This has been a consequence of the shale gas boom which has dramatically reduced US gas feedstock costs, and as a consequence reversed the previous trend for US ammonia capacity to drift overseas to countries such as Trinidad. In 2012, at the peak of its import demand, the US bought 7.8 million t/a of ammonia from overseas. By 2019 this had fallen to 2.5 million t/a with the start-up of the 850,000 t/a Yara/BASF ammonia plant at Freeport, Texas. While most of the domestic ammonia capacity that was part of the current construction cycle has now been completed built, there are still plans for more plants further down the line. In particular, Gulf Coast Ammonia has achieved financial closure on a 1.3 million t/a standalone ammonia plant for Texas City which is due to be completed in 202324, and which will presumably reduce US ammonia imports still further.

Trinidad
Trinidad, conversely, is facing increasing pressure on its ammonia exports as US demand contracts. Although Trinidad remains the world’s second largest exporter of ammonia, its position on the top spot has been taken by Russia in recent years, while domestic gas supply issues have hit production, reducing operating rates to below 75%. Trinidad’s exports of ammonia were 4.3 million t/a in 2019, but this is down from 5.3 million t/a a few years earlier.
Gas costs have also become a major issue for Trinidadian producers. The Natural Gas Company of Trinidad and Tobago (NGC) buys gas from local gas producing companies and sells it on to downstream producers, and it has faced difficulties in price negotiations in both directions. Currently downstream producers pay around $2.00-2.50/MMBtu for natural gas, comparable with US prices. However, NGC wants this to rise to $4.00/MMBtu or more to pass more money to upstream producers and incentivise them to exploit more of the island’s reserves. Coupled with the impact of the Covid-19 crisis this has led to a number of shutdowns of ammonia and methanol capacity on Trinidad recently, including two of Nutrien’s four 600,000 t/a plants.
North Africa
Major changes are occurring in North Africa. In Morocco, OCP, the world’s largest phosphate company, is continuing to massively increase its downstream processed phosphate production to gain a greater slice of this market. Production of extra mono- and diammonium phosphate necessitates increased imports of ammonia. Morocco imported 1.5 million t/a of ammonia in 2019. This has risen dramatically from just 270,000 tonnes in 2008, and it is set to increase by another 1.2 million t/a when the next batch of planned MAP/DAP plants come on-stream over the next few years.
Further east, Algeria and Egypt have both been building new capacity, mainly with downstream urea capacity, but some additional surplus ammonia should also be available, including 300,000 t/a from Fertial in Algeria.
China
China is in the midst of a major shakeup of its domestic fertilizer production and use as the government tries to tackle overapplication of urea and consequent nitrate leaching into water courses, and air pollution caused by coal-based production of chemicals. There is also a considerable amount of structural overcapacity in most Chinese chemical sectors. Stringent new environmental legislation has closed a large tranche of Chinese ammonia capacity. Around 8 million t/a of ammonia capacity (mostly integrated into urea production) has closed since 2015, and IFA estimates that another net 7 million t/a may close over the next few years.
The Chinese government has also attempted to move to zero growth in fertilizer demand from 2020 to encourage more balanced and efficient use of nutrients. This impacts both upon ammonia demand for urea, but also for ammonium phosphate production. Ammonia demand for industrial production continues to rise, but the slowdown in the Chinese economy has also affected how fast industrial demand is rising. Overall, China has become a net importer of ammonia (about 560,000 tonnes in 2018), but this figure may rise as domestic closures mount.
Russia
Russia has dramatically increased its exports of ammonia with the start-up of 890,000 t/a of new export-oriented capacity in the past two years at Eurochem’s Kingisepp site in northwest Russia. Cheap gas and rising domestic demand for fertilizer is leading to something of a boom for Russian nitrogen production, with several major new plants under construction at Gubakha, Togliatti, Kingisepp, Novgorod and Nevynnomyssk. However, several of these are downstream urea or nitric acid plants with no associated ammonia production, and will in fact absorb some of Russia’s ammonia surplus, leading to lower availability once the plants come on-stream in 2021-22.
Meanwhile, to the south Ukraine was also once a major exporter of ammonia, but the conflict in the east of the country and high gas prices have shut down much of the country’s production. The export-oriented Odessa Port Plant (OPZ) has been operating only intermittently because of unpaid gas debts.
Iran
Iran exported around 850,000 t/a of ammonia in 2018, making it one of the largest exporters in the Gulf, mainly to India. However, the pull out of the US from the Iran nuclear deal and subsequent resumption of US sanctions on the country has complicated matters. China has become the main buyer of Iranian ammonia, although it is believed much of this is then re-exported. Ammonia exports from Iran are believed to have actually been slightly up in 2019, but the impact of Covid-19 on both Iran and China remains unclear at present.

Other new capacity
Recent standalone capacity includes the 660,000 t/a Panca Amara Utama (PAU) ammonia plant in Indonesia, which began operation in 2018 and which has displaced some imports into southeast Asia. Other projected new merchant ammonia capacity over the next few years includes the new Salalah Methanol plant in Oman, which will add 330,000 t/a of capacity by 2021, and potentially some surplus from a third ammonia plant for Ma’aden at Wa’ad Al Shamal, although most of the ammonia will go to ammonium phosphate production. Furthermore, beyond these there is actually not a lot of new merchant ammonia capacity on the horizon. Morocco’s OCP is in discussions with Nigeria over the potential construction of a 750,000 t/a ammonia plant in Nigeria by 2023, though there are also reportedly plans for downstream ammonium phosphate production at the site, using phosphoric acid supplied from Morocco, so the net addition to ammonia production may once again be limited.
Oversupply
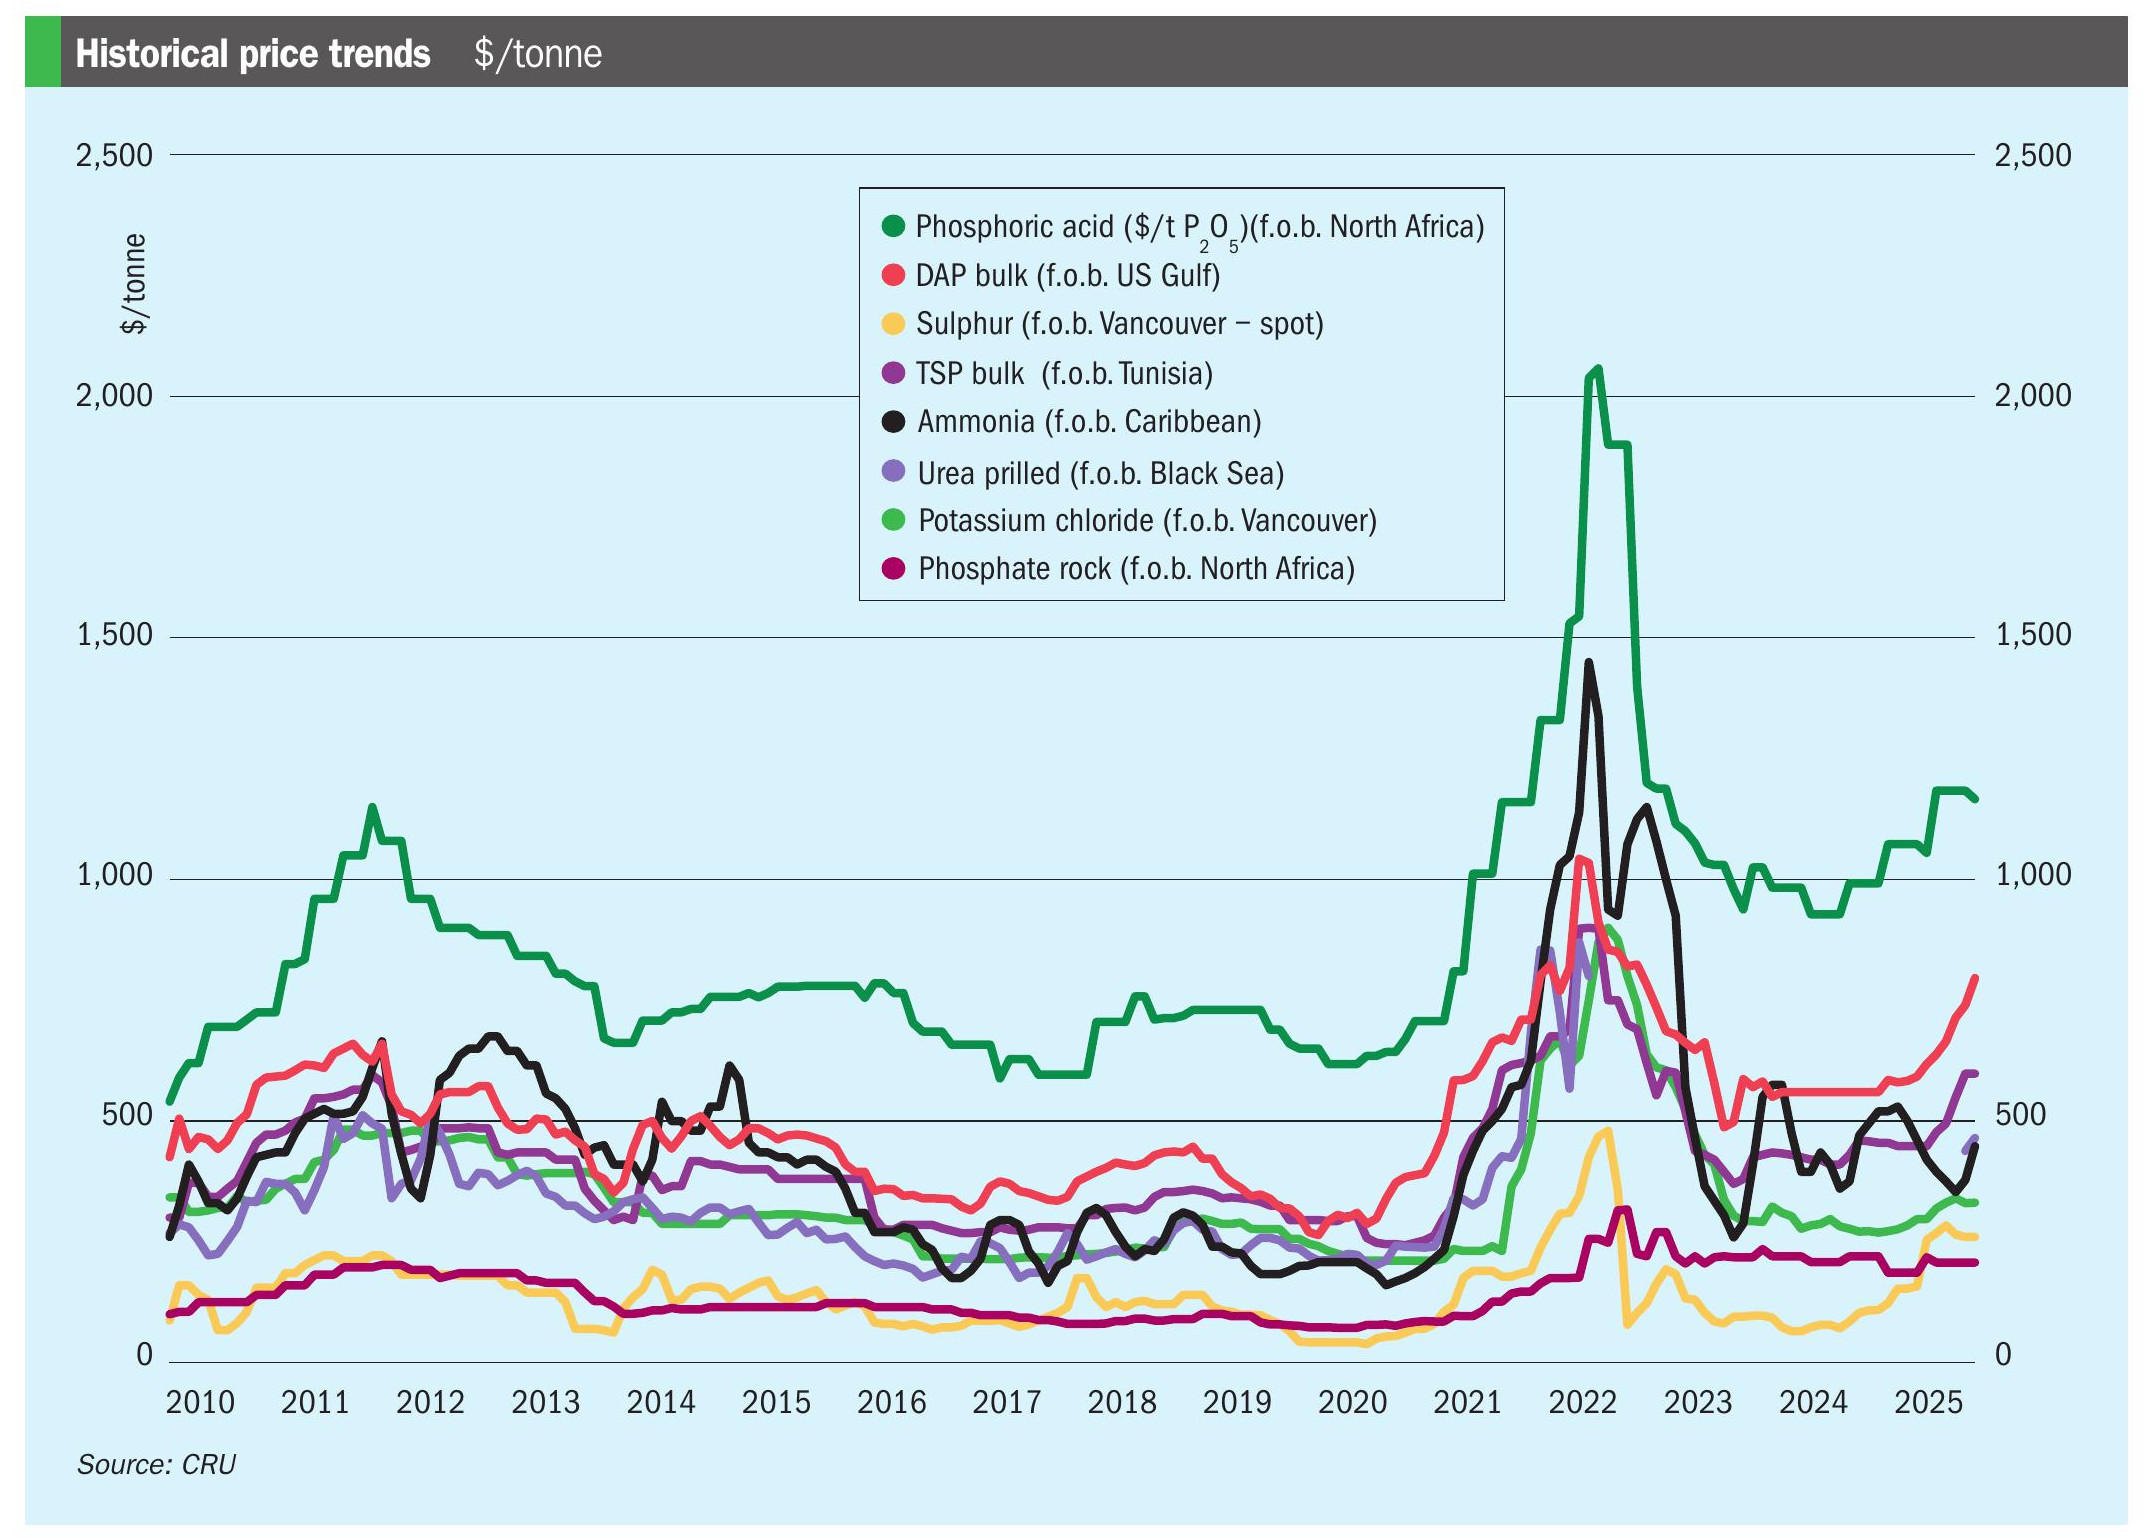
The start-up during 2018-19 of three major new merchant ammonia plants added 2.4 million t/a of new ammonia to the market, equivalent to more than 20% of the usual merchant ammonia market, and has led to a period of oversupply. Lower than expected direct ammonia applications in the US last year due to bad weather and slack demand in the phosphate sector have at the same time also affected demand, and magnified the effect. Consequently, prices have fallen to historically low levels. A factor in supply of ammonia is the relative price differential between ammonia and urea prices. When ammonia prices are significantly above those for urea, producers who are capable of doing so are encouraged to shut down the urea section of their plant and sell ammonia instead. As Figure 1 shows, ammonia prices were significantly ahead of urea prices for much of the period 2010-2015, and this encouraged the construction of the standalone ammonia capacity that came onstream during 2018-19. Now however, ammonia prices are relatively low and so the incentive to produce ammonia alone is greatly diminished. This should mean that there is a market correction over the next few years as demand increases without a significant increase in supply (and, in the case of Russia and Trinidad, the potential net removal of capacity – in the former case to feed urea production, in the latter for gas price/ supply reasons).
This year
The Covid-19 outbreak has naturally had an impact on the ammonia market. In particular, lockdowns in China and elsewhere have adversely affected industrial demand for ammonia in particular. At the same time, very low natural gas prices, especially in Europe, have allowed ammonia producers to kee p operating, albeit at low margins. The result is continuing weakness in the ammonia market, in spite of intermittent operating problems at Yara’s 850,000 t/a ammonia plant at Pilbara in Western Australia which have taken some ammonia off the market, and the idling of some of the ammonia plants on Trinidad, as well as in Egypt and Indonesia.
As industrial production recovers in Asia, and with a better ammonia fertilizer application season in the US, the oversupply will ease, but there is still a lot of ammonia in storage that will weigh down upon pricing. Looking towards the medium-term future, and depending upon what course the Covid-19 crisis takes, more demand growth is expected for Indian and Moroccan phosphate production, industrial production in Europe as well as some Turkish nitrate and NPK production, and potentially in China to balance capacity closures. This plus the additional requirement for ammonia in Russia for urea and nitrate production will gradually absorb the ammonia surplus, but it could take a couple more lean years for the merchant ammonia market.


