Nitrogen+Syngas 368 Nov-Dec 2020
30 November 2020
Digital solutions bringing better performance
DIGITAL INNOVATIONS
Digital solutions bringing better performance
By harnessing the power of real-time data and exploiting the opportunities provided by digital solutions plant owners can achieve greater plant efficiency and reliability. In this article Stamicarbon shows the benefits of the Stami Digital Plant Optimiser for urea plants, OnPoint Digital Solutions provides a case study on optimising primary reformer heater operations using Smart Combustion™ , TOYO provides an update on its digital transformation service DX-PLANT® and thyssenkrupp Industrial Solutions provides examples of how digital solutions can be used to improve plant operation.
Urea operation with the Stami Digital Plant Optimiser
For a urea plant, achieving operational excellence means making optimal use of available resources and process equipment. Stamicarbon, the licensing and innovation centre of the Maire Tecnimont Group has always been on the forefront of developments and innovations, helping urea producers to improve plant performance and maximise production.
The following sections describe the Stami Digital Plant Optimiser that monitors and optimises the operation of the urea plant every minute, hour and day, providing urea producers with enhanced reliability of operation by ensuring continuous and consistent best-practice operation1 .
Interaction between the variables
All urea stripping plants are characterised by a high degree of interaction among the process variables. Any change at the back end will affect the synthesis and vice versa. These are typical control characteristics for plants incorporating multiple recycles. The dehydration of ammonium carbamate to urea and water is slow, which requires large retention times in the reactor (typically one hour). This reactor hold-up is characterised as a “pure dead time” in the process. Dead time is the property of a physical system by which the response to an applied disturbance is delayed in its effect.
The Stami Digital Plant Optimiser combines the benefits of a multivariable, model-predictive control (MPC) system with the non-linear optimisation capability of Stamicarbon’s urea process modelling tool. It uses a model of the urea process to predict the behaviour of the plant in the foreseeable future (typically several hours ahead). Knowing what the safety and operating limitations and the quality specifications of the process are, it will calculate the optimal adjustments to be made to the process, and implement these adjustments, by sending small changes to the setpoints of key process variables in the distributed control system (DCS). This provides urea producers with improved reliability in operation by ensuring continuous and consistently optimal operation.
Optimiser description
The basic principle of an MPC system is to use knowledge of the process transfer characteristics. Understanding the relations between manipulated variables, measured disturbances and controlled variables, the process can be continuously feedforward driving to the desired operating conditions. Using data-driven dynamic models derived from step-testing, the MPC controller stabilises the process operation and pushes it as close as possible to process limits, e.g. synthesis pressure. The Stami Digital Plant Optimiser builds upon the Stami Digital Process Monitor (see Nitrogen+Syngas May-June 2020)2 that calculates key performance indicators (KPI’s) such as the plant load, ammonia emission and energy consumption and soft sensor key variables. These soft sensor key variables provide additional process information which is not measured or cannot be measured, such as stripper tube load and efficiency or ammonia emission. These soft sensor key variables have been included in the MPC design as control objectives.
The Stami Digital Plant Optimiser directly anticipates the effects that disturbances have on the process outputs that are controlled as soon as these disturbances are observed. It then directly steers the process to new operating conditions. On the contrary, a traditional feedback control system like a PID controller first needs to observe the effects of disturbances at the controlled process outputs before it can start counteracting these disturbances. In some cases, e.g. reactor N/C-control, it takes a while before the effects of disturbances on the controlled process outputs can be measured.
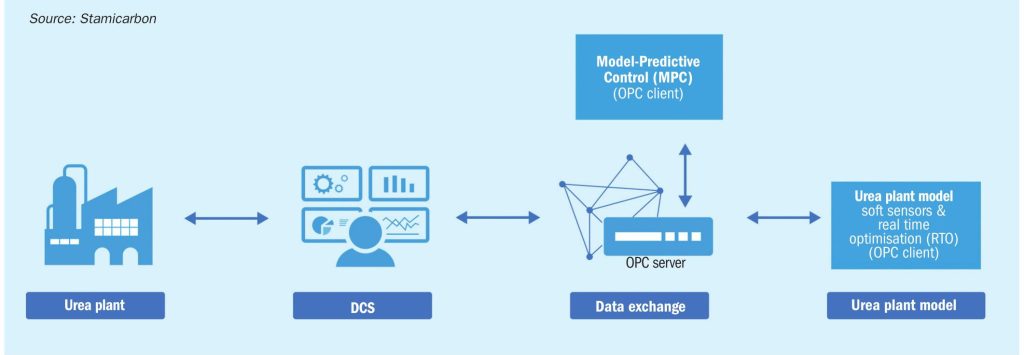
Without the Stami Digital Plant Optimiser, corrective actions are left to the decision and discretion of the operators, while the Stami Digital Plant Optimiser automates operator handling and drives the urea plant to an optimised operating point by including real-time optimisation (RTO) and MPC as shown in the architecture of the Plant Optimiser system (Fig. 1).
The plant model is configured as a soft sensor which generates key variables, but also as a real-time optimiser. Optimal conditions for the process at steady state are determined by the RTO, while the trajectory to be followed as predicted with the use of a linear dynamic model, obtained through a plant step test is done by the MPC. Due to the typical complexity (high degree of interactions and recycles) of a urea plant, the MPC is the perfect tool to reach the optimal, stable operating point in a straightforward way.
Once the desired stability is reached, the MPC will be used to smoothly maximise the CO2 flow without violating any of the operating constraints, securing maximum attainable production capacity at any time.

Client experiences
A successful Plant Optimiser project has been executed on a urea plant with Stamicarbon’s Launch Melt™ pool reactor design, which currently runs at a capacity of 1,400 t/d. The client was searching for opportunities to improve the operation of the urea plant without having major hardware changes. The Stami Digital Plant Optimiser was selected as the optimisation tool. This urea plant is highly integrated with two melamine plants and an ammonium nitrate plant, providing additional challenges to the project due to its complexity. The project brought a lot of experiences and best practices to the benefit of all involved parties:
Current operation is not always optimal
The first lesson learnt was that a plant model is as smart and accurate as you make it! Since the urea plant has a large operating window, the model needed to be programmed in a robust way to cover all the operating cases. The validation of the plant model with historical data which was done using Stamicarbon’s Advance Consult™ system, revealed unexpected surprises. At some points, the model predictions and trends deviated from the client’s own experiences and practices. This led to several discussions between the process engineers of the client and Stamicarbon. In this phase it became clear that the urea plant was not operated in the optimal way. Based on the outcome of these discussions the client was able to increase its urea production. For the client this was a very valuable period in the project, as it was already paying off before it was implemented.
Implementation can take time
It turned out that the implementation phase of this project took longer than expected. This was due to three main reasons. First of all, the difference in opinion of the process engineers on optimal operation took time. Secondly, some critical instruments were not functioning properly which effected the implementation of the control strategy in the MPC controller. Finally, in order to perform the step tests, the plant should be operated at nominal conditions. Planning of the right resources available, combined with the right plant condition was more complex than was foreseen.
Optimisation can be a repeat process
If at a later date the plant operation changes, because of a debottlenecking project for example, the plant model and the dynamic model from the MPC will need to be adjusted. Consequently, certain step testing might need to be repeated facing the same constraints as described above.
Results
The Stami Digital Plant Optimiser calculates the ideal N/C-ratio in the pool reactor on which the MPC anticipates. Because of an improved yield in the reactor, the total production capacity increases. Also important to realise is the reduction in variations on the N/C-ratio once the optimiser is switched on. The stripper tube load is continuous calculated by the plant model, and the specific energy consumption is lowest at maximum tube load. The stripper tube load is configured as a constraint in the MPC, meaning a certain value may not be exceeded. The MPC nicely steers to maximum value.
For the above-mentioned project the Stami Digital Plant Optimiser realised a 4% production increase and a significant decrease of the energy costs. The results achieved by implementing the Stami Digital Plant Optimiser exceeded expectations; not only in plant performance, but also in the knowledge gained.
An optimisation criterion might be to maximise load or, given constraints in feedstock, minimise energy consumption or some other objective function. Using the process model for plant optimisation becomes powerful when used in conjunction with an MPC. The implementation of the Stami Digital Plant Optimiser does not require any hardware changes, nor does it require a plant shutdown. The extension is limited to software only.
Typical benefits from the Stami Digital Plant Optimiser are a 1% to 5% increase in production, a 1% to 3% decrease in specific energy consumption, a higher on-stream factor and more hands-off operation due to the decreased interventions by operators.
The Stami Digital Plant Optimiser is part of the Stami Digital Product Suite which currently includes:
- Stami Digital Training Simulator; for training panel operators, field operators and plant staff engineers on all urea melt and urea granulation plant operations.
- Stami Digital Soft N/C Meter; for calculating the N/C ratio without the need for a hardware-based N/C meter.
- Stami Digital Process Monitor; for proving KPIs and soft sensor key variables dash board information enabling the operators and plant engineers to better control and optimise their urea plant.
- In line with Stamicarbon’s digitalisation strategy further digital products are on their development roadmap.
Optimising fired heaters with Smart Combustion™
Primary reformer fired heaters are complex systems that are challenging to operate and optimise without substantial, direct operator oversight and involvement. Generally, there is limited real-time operational combustion information readily available to proactively identify combustion related problems or effectively optimise combustion operations. This means that site personnel must expend significant time and effort to monitor operations and assess operational issues such as flame impingement, burner tip plugging and temperature imbalances.
OnPoint’s Smart Combustion digital solutions solve these problems by utilising information from existing process heater instrumentation in real time analysed with proprietary, equipment specific combustion calculations to provide combustion insights and targeted recommended operational adjustments to plant personnel to optimise heater combustion performance resulting in decreased emissions, improved reliability and safety and increased efficiency and heater throughput3 .
Steam methane reformers
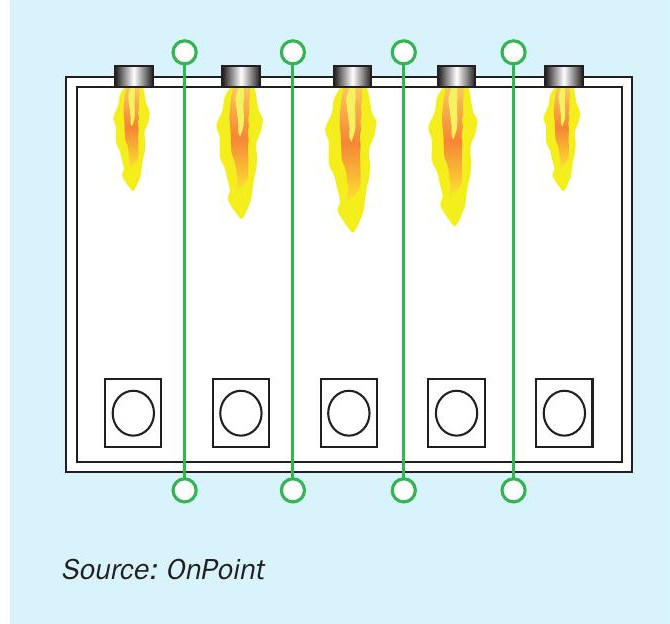
Steam methane reformers are generally large, rectangular heaters with multiple types of burners installed in different locations around the unit. The majority of the heat input into the reformer comes from the arch burners which are located in the roof of the furnace and installed in rows between rows of process tubes. This is illustrated in Fig. 2. A typical reformer has 100-200 arch burners. The air flowrate to individual burners can typically be controlled by manually adjusting air register settings. However, the fuel flow is typically only controlled by global or zonal control valves. This can lead to imbalances with individual burner fuel to air ratios resulting in poor combustion performance.
Each burner will generally have an isolation valve installed upstream of the burner that should only be used to turn burners on or off. However, some operators will attempt to use these valves to throttle the fuel to individual burners. This is not recommended as this causes an adverse redistribution of the remaining fuel to other burners that can result in fuel maldistribution, un-even heating and unsafe operating conditions.
Burner design considerations which are important in a steam methane reformer are flame length and air momentum relative to other burners. It is common for these heaters to be operated with either induced or balanced draft systems with preheated combustion air. Balanced draft systems create a challenge to optimise as the duct work from the forced draft fan to each individual burner needs to be designed so that all burners get equal air distribution to ensure proper combustion can be maintained. Typically, plant constrains do not allow an optimum duct design, resulting in maldistribution of combustion air to the burners.
Ember is a cloud-based, digital tool which takes real-time data collected from existing instrumentation recorded in the site historian, analyses it in specifically derived physics-based models and returns operational insights and burner adjustment recommendations back all in just a few seconds. These insights and recommendations can be used by operators or plant engineers to make prioritised, targeted adjustments to individual burners to improve operations to a desired target objective. Iteration is no longer required to find the right set point. Ember tells you exactly how to adjust and set the burners the first time for specific operating conditions.
Some of those insights include burner-byburner stoichiometry, recommendations for how to set air registers and even can advise how much your gas tips are plugged so that proactive rather than reactive maintenance can be done. The Ember app also combines all the burner performance information together to give you an overall efficiency score of the heater. When Ember is installed on multiple heaters, comparing Ember outputs allows for you go to focus on the areas with the biggest opportunity in real-time. As soon as an operator logs an air register change, the system will update, giving instant feedback the actions you are taking make a real difference inside your facility. The Ember mobile app also provides a platform to take pictures and record notes about individual burners for maintenance or other reasons.
ZoloSCAN
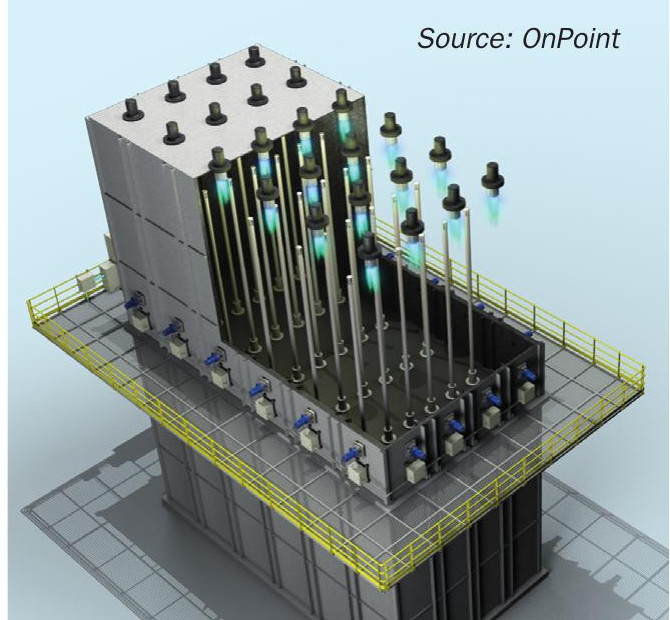
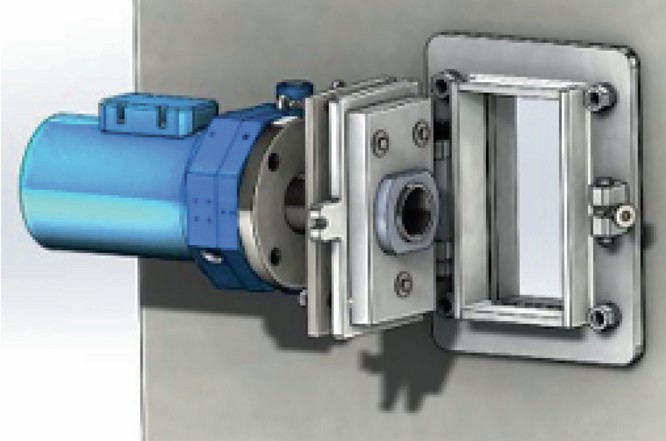
ZoloSCAN is a laser-based measurement system which can be used to monitor temperature, oxygen, CO, methane, and water inside of the firebox. Its fibre coupled architecture allows for multiple paths and zones to be sampled from a single system (see Fig. 3). The system can be installed while the heater is online using our innovation sight port retrofit kit. This kit replaces existing view or sight ports with a bolt on assembly which retains the same viewing capability as before but adds a mounting for the SensAlign™ head (see Fig. 4).
Case study
Before applying Smart Combustion, a user was experiencing a large variation in their coil outlet temperatures and observed poor combustion performance, long lazy flames, and flame impingement on process tubes leading to premature catalyst deactivation and accelerated process tube failure. A holistic solution of Ember and ZoloSCAN were used on this unit to troubleshoot and solve the combustion related issues the customer was experiencing.
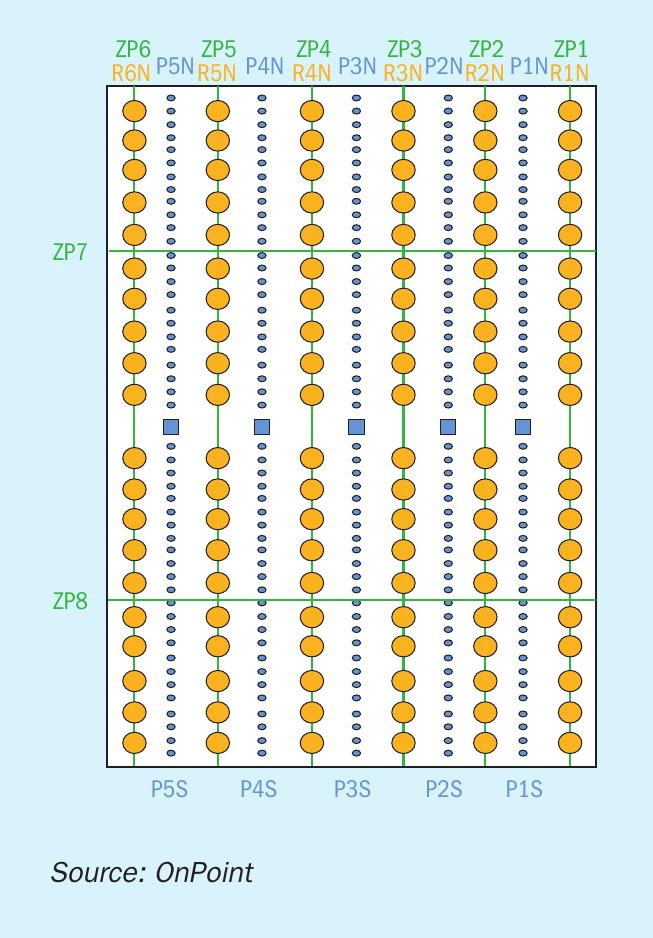
Before installing ZoloSCAN, the site had temperature, oxygen and CO analysers at the exit of the radiant section. This allowed for a global overview of products of combustion but without the ability to identify imbalances of temperature, regions of high or low oxygen and the origin of CO across the heater if global excursions were observed. The addition of ZoloSCAN allowed OnPoint and the user to see flue gas temperature and oxygen measurements in each burner lane, giving a more granular view of combustion operations (see Fig. 5). The ability to monitor CO in each burner lane also allowed the operator to troubleshoot high CO readings more quickly, a typical indicator of poor or unsafe combustion.
In general, process burners inside the same fired heater are designed to be operated at the same excess air/stoichiometry to promote equal combustion and therefore heat transfer across the reformer. As you can see from the graph in Fig. 6, the actual operation was much different.
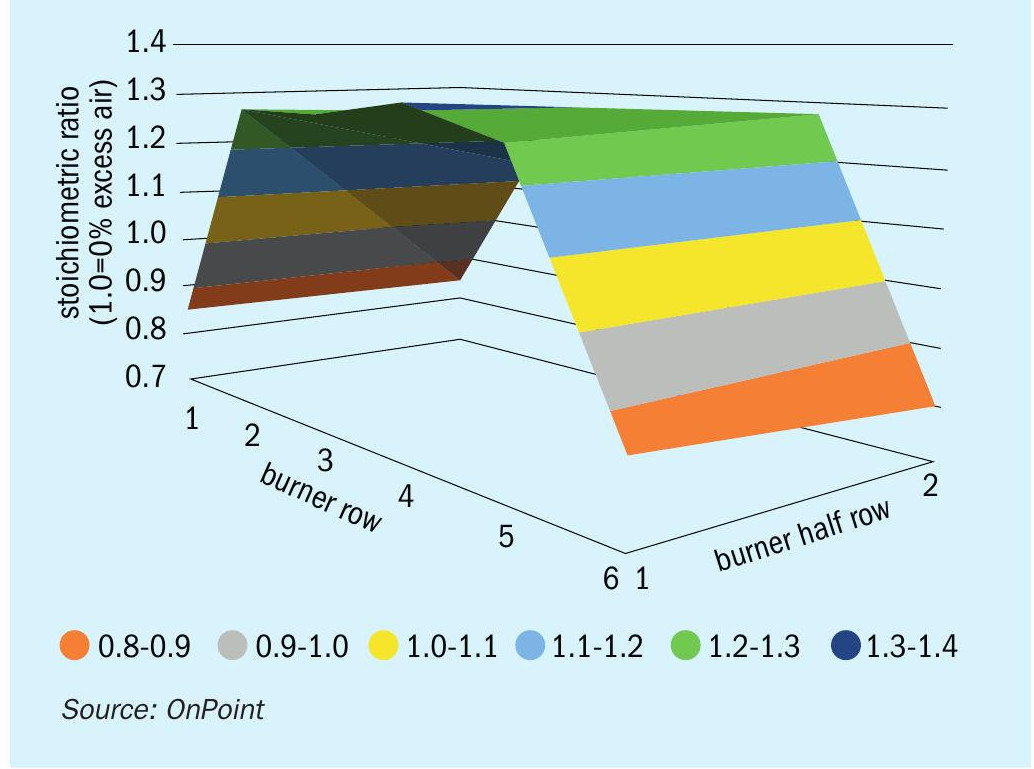
This graph illustrates a map of excess air across the entire reformer. Each number on the x-axis, (band of colours) represents a row of burners. This particular reformer had the ability to modulate fuel to each burner half row and an average of the excess air across this half row is indicated on the graph. The legend explaining the colours indicates a range of burner stoichiometry. As you can see from the figure, the middle part of the reformer was very high on excess air (as high as 30-40% excess air) and the outer rows of burners were operating substoichiometrically (as low as -20% of the required theoretical air), or below the minimum required amount of air needed for complete combustion. Since only a single oxygen analyser was installed at the exit of the radiant section, this burner stoichiometry imbalance was not evident as the products of combustion mix and became more uniform 1-2% excess global oxygen by the time they exit the radiant section.
Inside the furnace, combustion concerns such as bushy flames, longer than expected flames and visible flames rolling into the process tubes (see Fig. 7) were observed. Understanding the specific changes to individual burner settings to solve these problems requires real time operational data from the furnaces and a deep understanding of the physics behind how the burners work.

Using measurements from furnace instrumentation and ZoloSCAN combined with the outputs from Ember, OnPoint and the site worked together to identify the root cause of the issues they were experiencing and correct the issues by adjusting individual burner dampers using the Ember recommendations.
Fig. 8 illustrates the excess air plot across the entire radiant section of the reformer after implementing the burner adjustment recommendations from Ember.
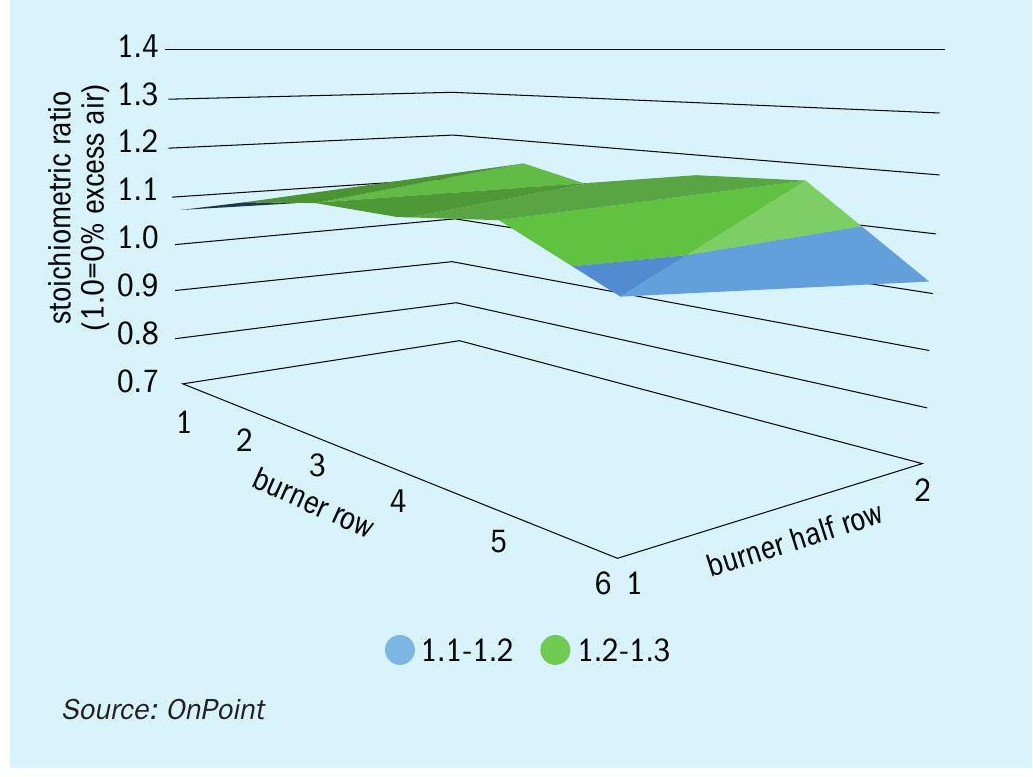
The oxygen distribution is more uniform and no burners were operating substoichmetrically. The global oxygen level remained the same as before. A picture of the same burners after tuning is shown in Fig. 9.

Results
Installing and utilising the Smart Combustion digital solution resulted in several operational improvements the site was able to capitalise on. Balancing the oxygen created a better temperature balance across the box which led to improved heat transfer. This resulted in more uniform coil outlet temperatures and eliminated localised hot spots which were present previously. Elimination of localised hot spots increases tube and catalyst life allowing the unit to capture increased production days between outages. The additional data obtained by ZoloSCAN combined with the combustion insights and recommendations from Ember sensors also allowed for faster and safer furnace start-ups.
The site was able to realise $350,000/ year in fuel savings alone from better utilisation of the heat inside of the furnace without increasing the firing rate. The changes also allowed the site to increase throughput up to 7% to take advantage of market conditions. The site now has the real time data and digital tools to keep the reformer in its optimised state at all times, even as process variables change.
TOYO adds new services and digital solutions to DX-PLANT®
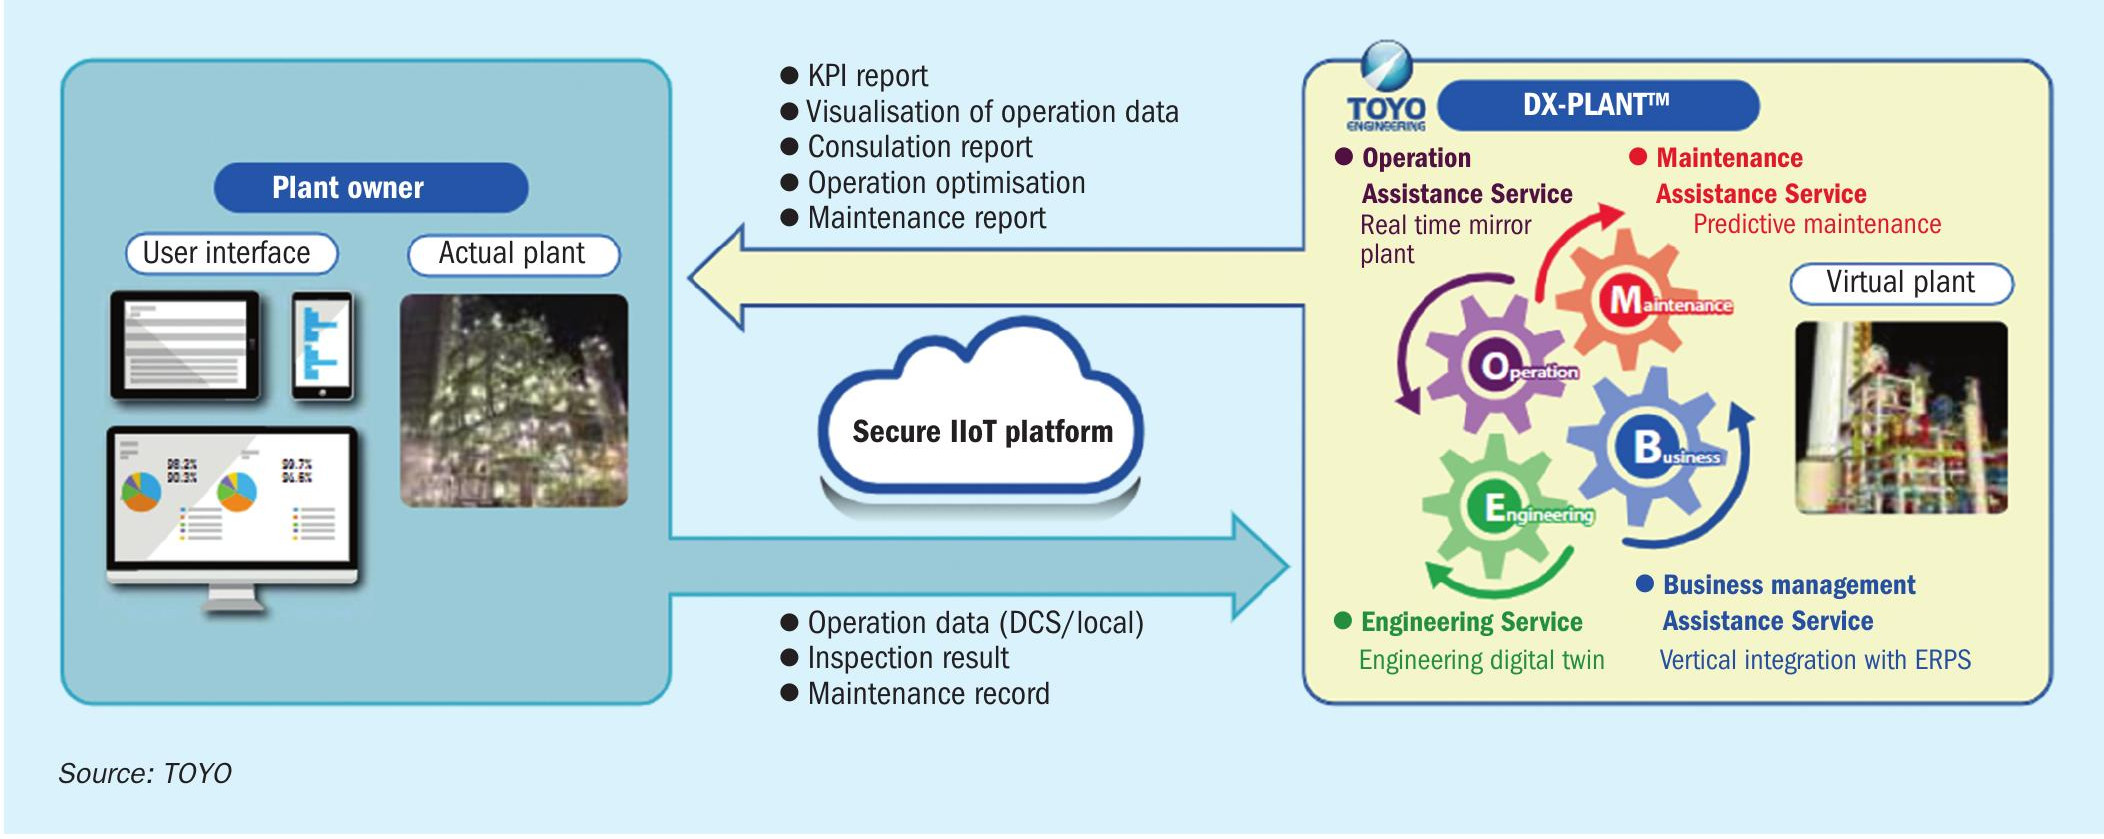
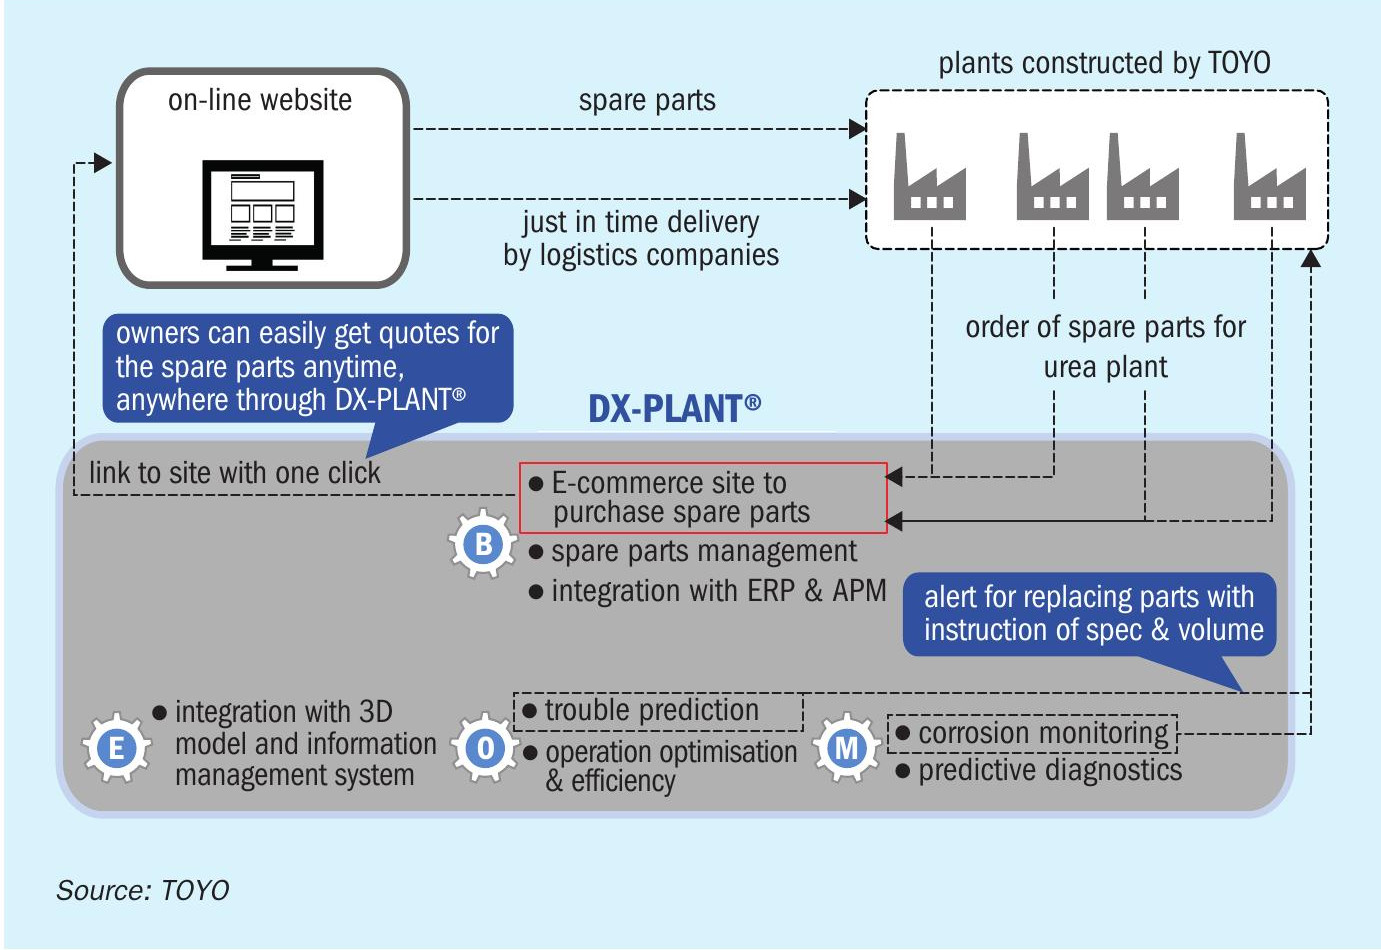
In 2016, Toyo Engineering Corporation (TOYO) launched a digital transformation service named DX-PLANT® for chemical and industrial plants by leveraging IoT and big data analysis technology. DX-PLANT® provides unique solutions focused on: Engineering (E), Operations (O), Maintenance (M) and Business (B) for maximum benefit to TOYO’s plant owners (Fig. 10). TOYO takes pride in realising the “digital twin” of a real plant using DX-PLANT® which has been reported in previous issues of Nitrogen+Syngas4,5,6 .
This article addresses the latest updates to TOYO’s digital solutions.
E: Engineering / information management system
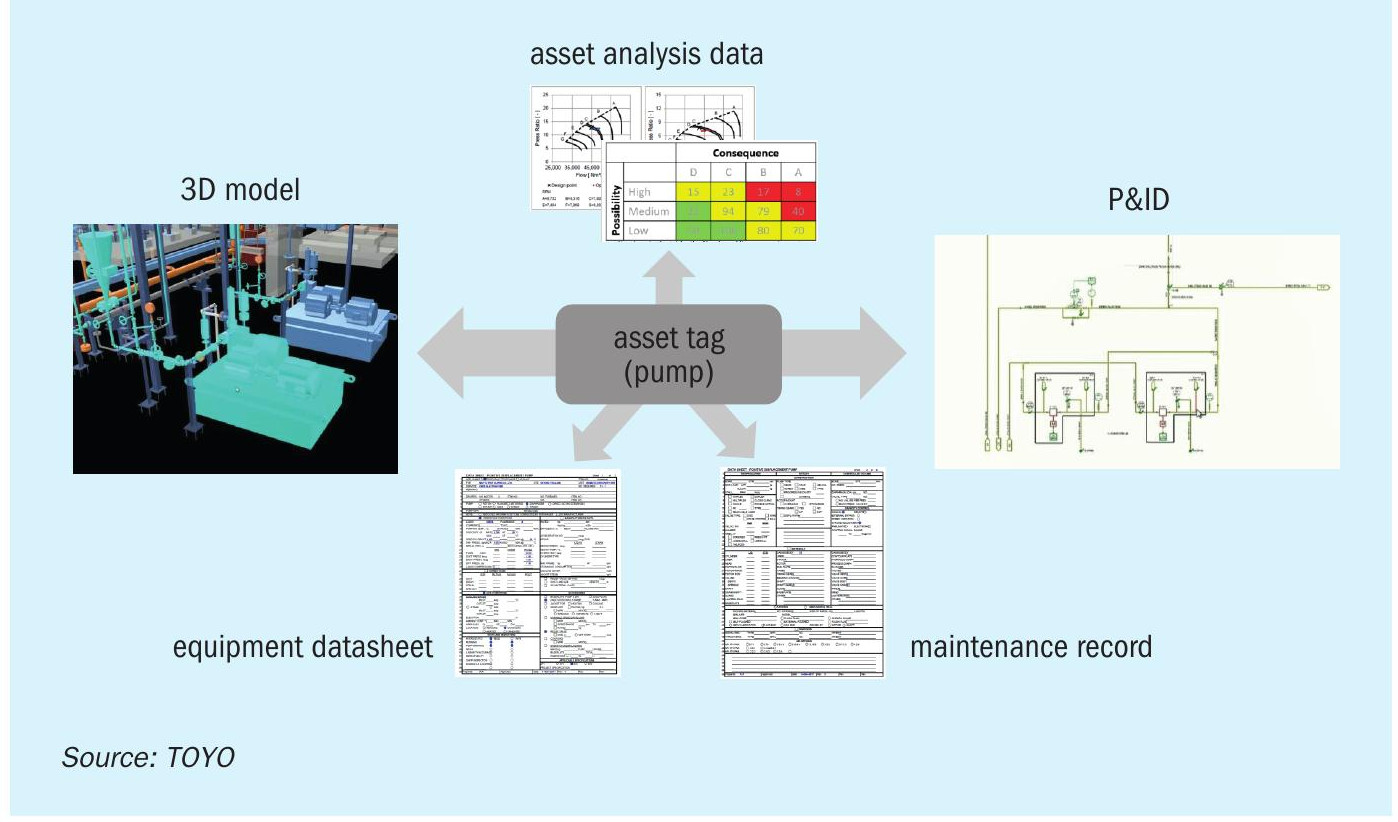
For efficient operation and maintenance of an industrial plant, various information such as engineering documents, maintenance records and/or inspection records should be made available in a timely manner, at any time. TOYO’s DX-PLANT® provides a unified information management platform, which enables users to access asset information through a 3D model, P&ID, operation dashboard, etc. (Fig. 11), as well as creating a user interface that appeals to the human five senses, instead of conventional textual information on paper, and makes it easy and intuitive to obtain the required information. Examples of the solutions include:
- AR (augmented reality) / VR (virtual reality) and smart glasses that appeal to the sense of sight;
- voice recognition that appeals to the auditory sense; and
- speech synthesis/smart speakers and haptic technology that appeal to the sense of touch.
The concept of TOYO’s smart speaker was reported in the July-August 2020 issue of Nitrogen+Syngas6 .
O: Operations/PMOS™ & ADVIDA™
In addition to real-time condition monitoring, such as key performance indicators (KPIs) and status diagnoses from a remote location, DX-PLANT® provides operation services around the clock with live specialists on duty. TOYO’s innovative new services (PMOS™ /ADVIDA™ ) relating to remote process monitoring are introduced below.
PMOS™
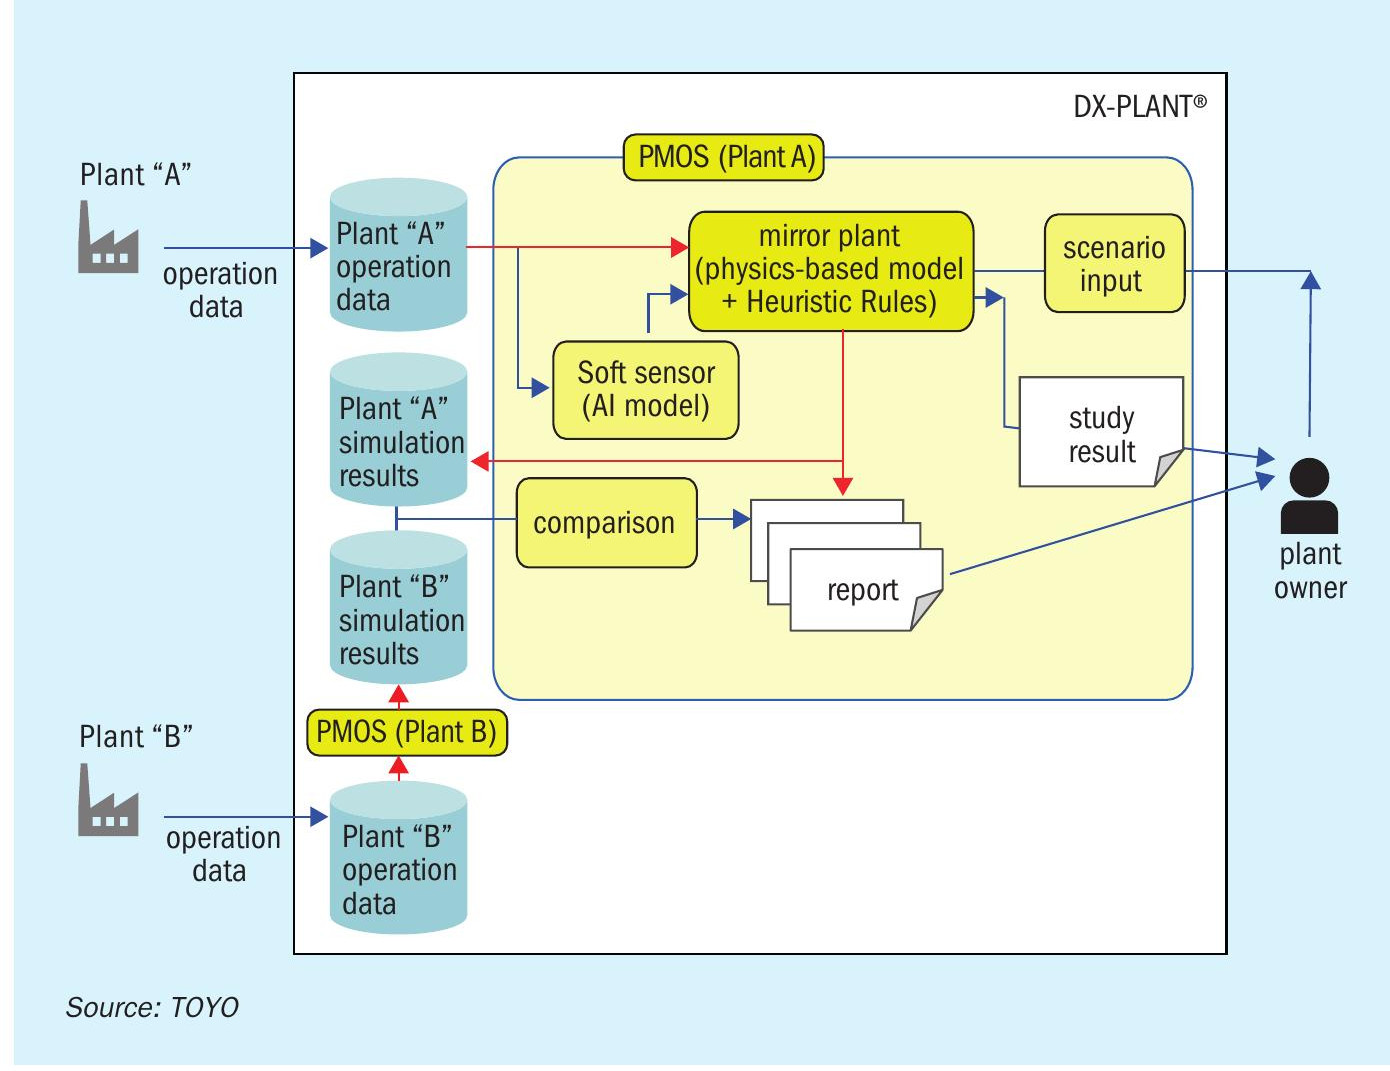
Some plant operation data, such as fluid composition and equipment performance, are not continuously monitored by the DCS (Distributed Control System). Conventionally, the fluid composition was carefully analysed by a laboratory and equipment performance was calculated by a process engineer at great effort. However, these conventional methods take time before the real state of the plant is known, making the plant prone to delayed decision making when there are problems. TOYO, therefore, developed the remote service named PMOS™ (Plant Monitoring & Optimisation System) to realise the creation of the actual state of a plant virtually based on the operation data acquired through DX-PLANT® . This newly developed PMOS™ consists of two functions: monitoring and optimisation.
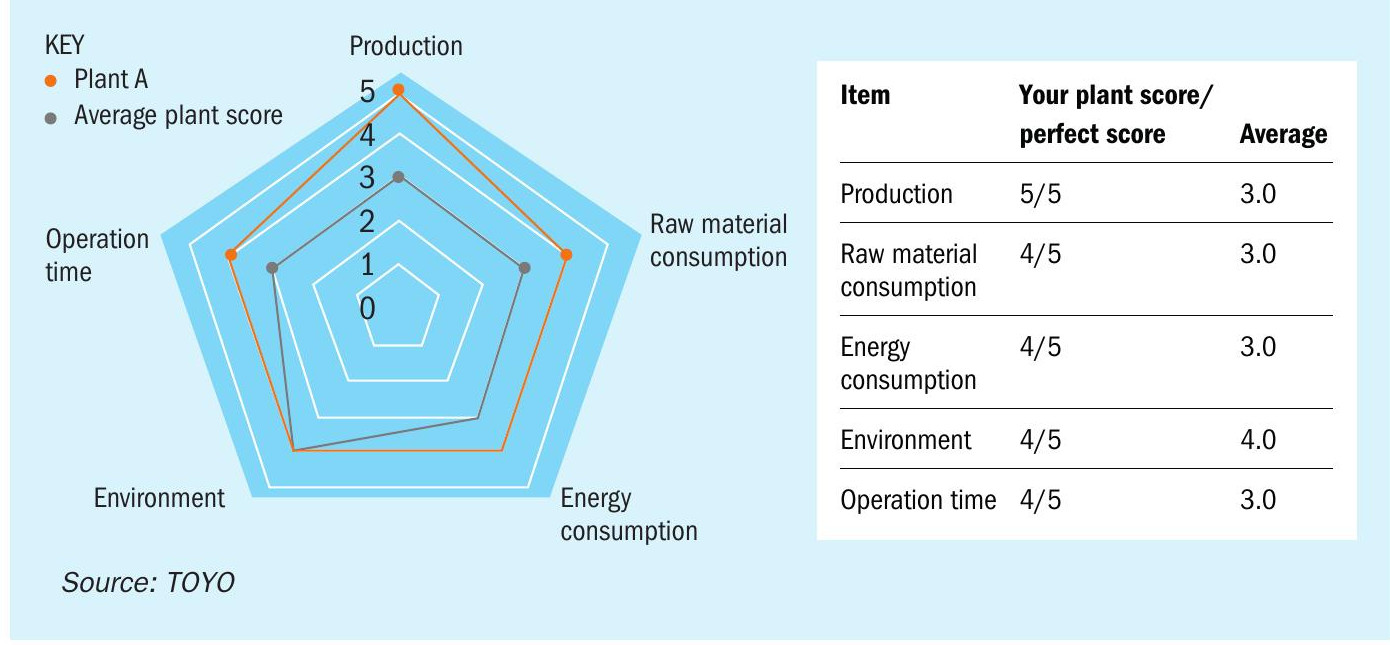
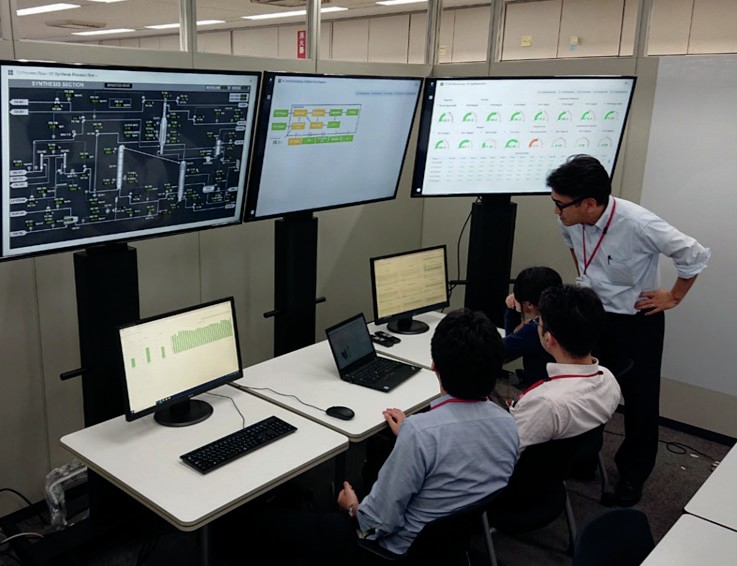
The monitoring function is a kind of remote supervision from TOYO’s headquarters based on real-time analysis utilising TOYO’s unique process simulator with expert algorithms. This remarkable service creates not only the actual operational condition in the cloud by reference to real-time DCS data but also automatically generates technical reports (daily and monthly) describing the real material balance, heat balance and critical equipment performance. The report also includes benchmarking, showing how the plant performance with regard to opex and environmental emissions compares to other plants (Fig. 12). With this guideline, plant owners can better understand their ranking against others and endeavour to improve their performance, if required, through TOYO’s support. The central monitoring room for this service was set up in TOYO’s headquarters for timely supervision and its live experts have monitored the real-time PMOS™ data of TOYO’s urea plants around the world (Fig. 13).
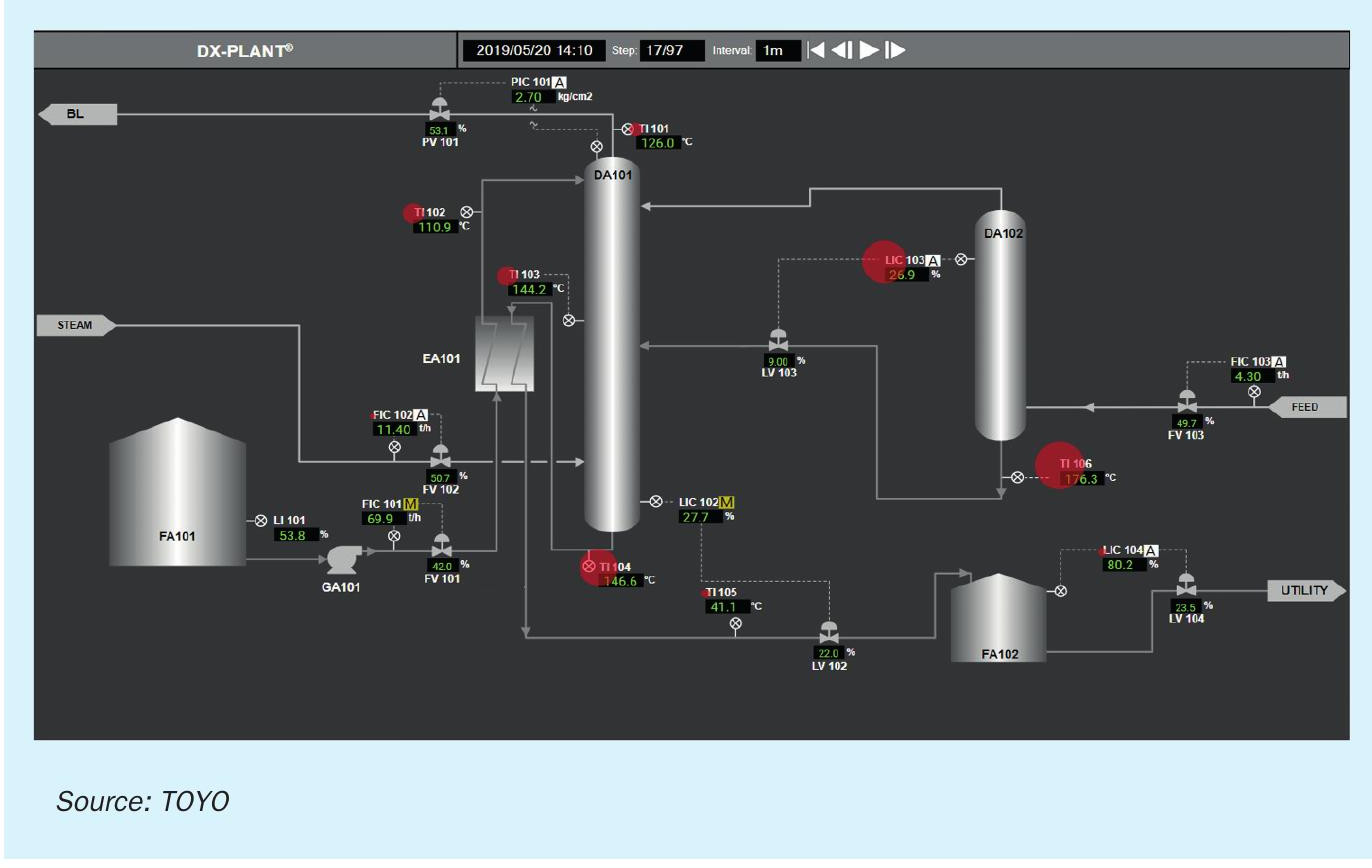
Meanwhile, the optimisation function studies all kinds of scenarios to help plant owners operate their plants under optimised operating conditions. For example, the ammonia to CO2 molar ratio (N/C) in the synthesis section of TOYO’s urea plant can be changed virtually allowing the plant operator to evaluate the new performance compared with the present condition (Fig. 14).
ADVIDA™
ADVIDA™ (Advanced Data-driven Visual Indication, Detection and Alert) is a refined anomaly diagnosis tool, developed to help DCS operators predict anomalies before they become too severe. TOYO focused on the following issues faced by plant owners:
- impractical, excessive number of items on DCS operators’ watch list;
- difficulty of high and low alarm setting to detect early-warning signs in a timely fashion.
This tool provides a visual symbol on the process graphics enabling DCS operators to grasp the magnitude of an anomaly compared to normal state at first glance. The size of the symbol varies depending on the degree of the anomaly (Fig. 15). By using this visual method, DCS operators are able to spot the anomaly in advance of normal alarm activation. In addition, the system is equipped with a replay function to view past events on demand. The facility to readily reproduce past events makes this tool suitable for training purposes, to educate and train young operators to analyse a time-series transition of events.
M: Maintenance/rotating machinery
Monitoring the performance of rotating machinery is considered essential, because deterioration of the performance will be directly linked to production loss with high repair costs. Usually, large compressors are equipped with a machine monitoring system (MMS) with a sensor ring which provides vibration analysis within one minute. In fact, an anomaly prediction system is provided by MMS manufacturers as standard; however, the function of the manufacturer’s system is limited to monitoring only the rotating machine itself, which means it cannot cope with a case where an anomaly happens due to factors outside of the machine. Therefore, overall monitoring covering outside the machine, which links up with the state of the machine, is indispensable. TOYO recognises its significance and has started the development of digital solutions with several manufacturers to address this issue.
B: Business/on-line spare parts procurement service
TOYO has recently launched a new service on DX-PLANT® supplying plant owners with spare parts for TOYO’s urea process. Plant owners typically spend a lot of time communicating with vendors with enquires for the procurement of spare parts using time-consuming procedures and paperwork. To make things quicker and simpler, a new service has been developed and is about to start which enables plant owners to contact manufacturers of spare parts directly through DX-PLANT® and to complete the procurement process intuitively and simply by referring to the image of spare parts on a platform, similar to shopping on Amazon. This new online service will completely eliminate conventional time-consuming communications spent on requests for quotations (RFQ) or purchase procedures for spare parts. TOYO envisages that just-in-time delivery of spare parts will become a reality by a centralised control system through this service with collaboration among logistics companies and TOYO’s plant owners around the world (Fig. 16).
Improving plant operation with tkIS digital solutions
For thyssenkrupp Industrial Solutions (tkIS), digitalisation is not an end in itself, but a promising tool that can bring concrete benefits to customers:
- better safety;
- higher uptime;
- higher production;
- better efficiency;
- improved maintenance planning.
Solutions for collection, handling, storage and processing of the vast amount of data generated by a plant are there to be turned into tangible benefits for the plant operator. Depending on the type of plant or process, this can be by a digital twin of the plant or by statistical data evaluation, or by other digital solutions, like an operator training simulator.
The following case studies show how tkIS can improve plant operation by digital solutions7 . Added value is created by combining state-of-the-art data analytics methods with thyssenkrupp’s expert know-how as process licensor and EPC contractor.
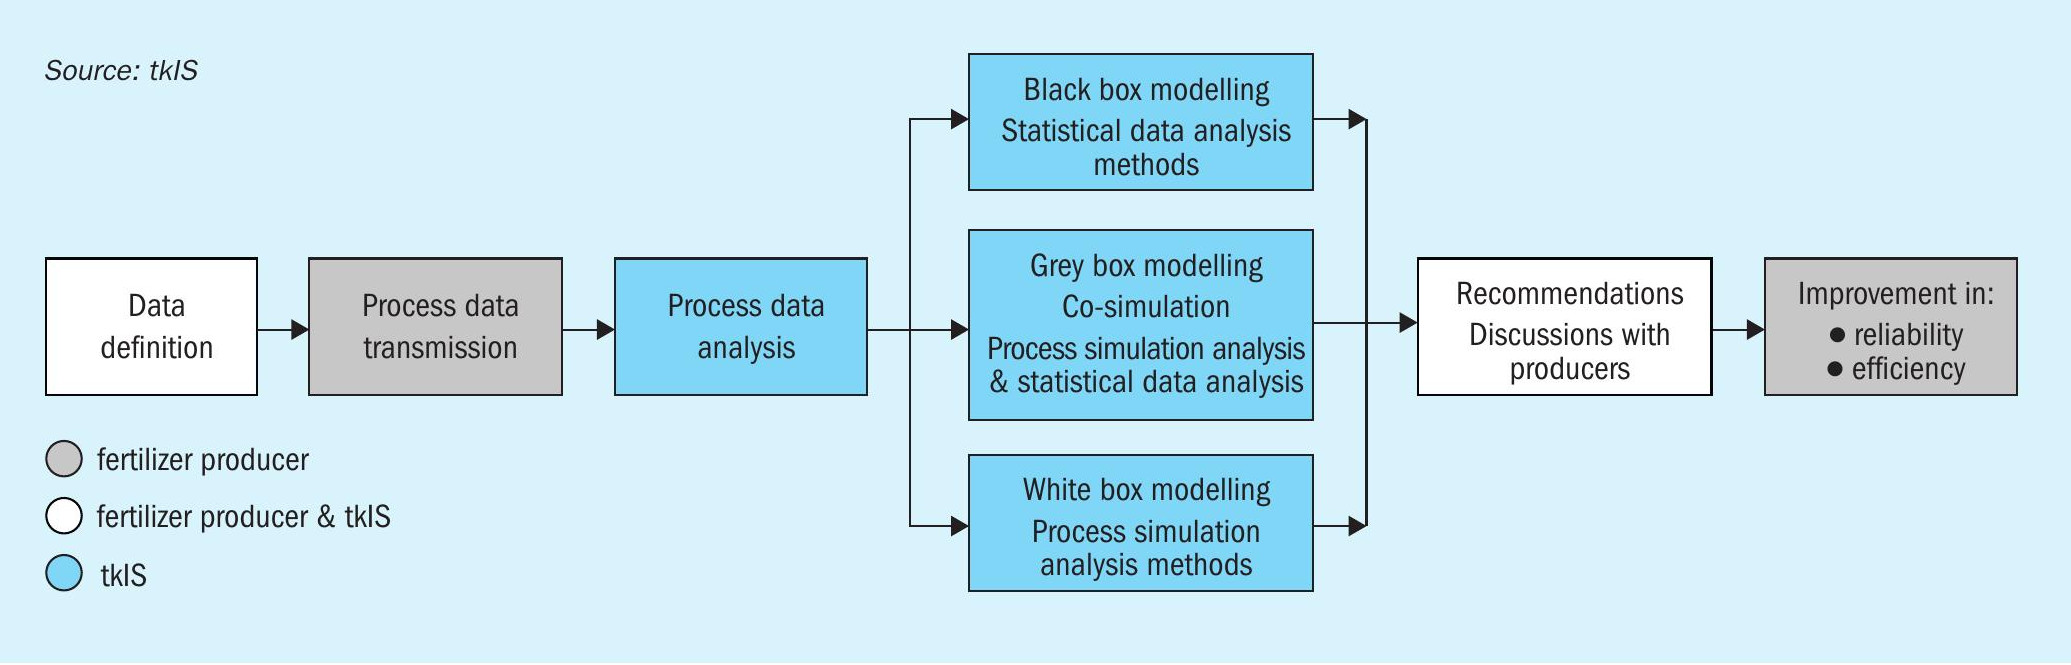
Fig. 17 is a schematic showing the interaction between the customer and tkIS. As shown, recommendations are extracted from the process data in different ways. Several approaches exist to combine artificial and human intelligence (expert knowhow). Selection is made depending on the process and the situation:
- Data-driven approach: Generic analytics and machine learning methods are employed, followed by expert interpretation of the results.
- Expert-driven approach: Known correlations, specifications and patterns are used as guiding principles for learning algorithms.
- Model-driven approach: Physics-based models and simulations are combined with real-time data analytics.
Case study 1
Digital twin of plant for improved operation
An example of the model-driven approach is the creation of a digital twin of the plant. A process model is set up for the plant or a part of it and, while the plant is running, a simulation is constantly carried out using measurements for the plant as input. The simulation can be used for several purposes:
- It can detect inconsistencies in the online measurements, e.g. if a change in concentration and temperature across a reactor do not match.
- It can provide virtual sensors, i.e. give information where no physical sensors are installed.
- It can be used for the tuning of control loops.
- The simulation can be used to look ahead in time, e.g. predict the behaviour of the plant with increased fouling of heat exchangers, deactivated catalysts etc.
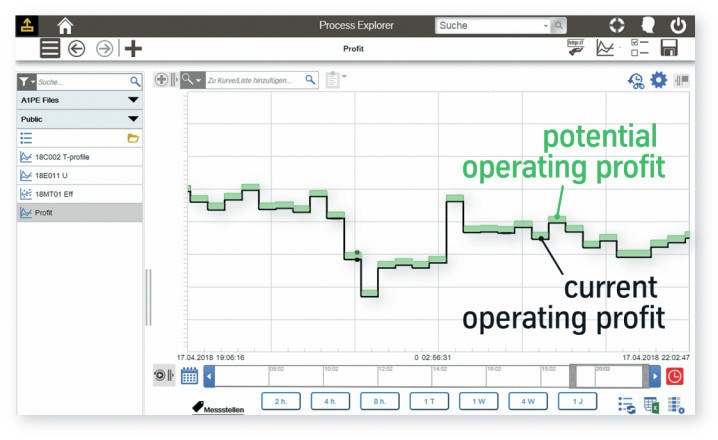
The simulation can be subjected to an optimisation algorithm with best process efficiency, maximum production, or any other parameter as the target function. It can thus inform the operator where selected process parameters deviate from the optimum and it can suggest a better setpoint. Such an algorithm has been implemented by tkIS at a fractionating column1 . Process parameters have been combined with product and utility prices so that the profitability of the current process can be determined and used as the optimisation target. Fig. 18 shows an example of the output to the operator where the margin for potential process improvements is displayed.
The analysis can be carried out by tkIS if the process data is exported from the plant’s control system to a safe tkIS server. The data can be made available online or in batches every day, every week or similar. The same principle also applies to the following case studies.
Case study 2
Statistical data analysis – trip prevention
Ammonia plant operating data from several hundred transmitters have been collected over several months, comprising both normal operation and time of unwanted loss of production.
The data is fed to a software package for statistical data analytics. It is treated in several steps: After pre-processing (cleaning by deletion of obviously erroneous measurements) average values, trends and standard deviations are determined. The data is then tested for correlations and anomalies and outliers are detected. An interpretation of these data by a process expert is made in order to train the software to distinguish between “good” and “bad” operating conditions.
In one case, it has been demonstrated that about ten days prior to a trip, the plant had been operating permanently under “bad” conditions, even though at first sight nothing abnormal could be seen in the individual data points8,9 .
That means, if such a system has been working in “live” mode with plant data it would have issued a warning that there was a mismatch in the data. This alone would not have prevented a failure or a trip but it could have been used to alert a process expert to have a closer look at a particular set of data.
It should be noted again that the evaluation is purely by statistical methods and (different to case study 1) with no process model or process simulation. Data which are not part of a usual process simulation like oil temperature, machine vibrations etc. are also part of the evaluation. The advantage is that this strategy also works with processes or parts thereof where no rigorous process simulation is available. The process know-how of tkIS is used in order to train the system and to find causes when an anomaly is detected.
Case study 3
Neural network for improvement of product quality
While the challenge in an ammonia plant may be to achieve most efficient production, in a CAN or urea granulation plant the challenge is to ensure a uniform product quality. Product quality parameters (e.g. composition, granulometry, hardness) cannot be measured online, they are tested in the laboratory, which means there is a time delay before they are available to the operator. As a consequence, off-spec product can accumulate before it is discovered.
Therefore, to be able to predict product quality based on process parameters which are measured online would be a great improvement. Unfortunately, the interdependence between process parameters and product quality is highly complex and there is no process model available which can be turned into equations for this purpose. However, an artificial neural network (ANN) can bridge this gap.
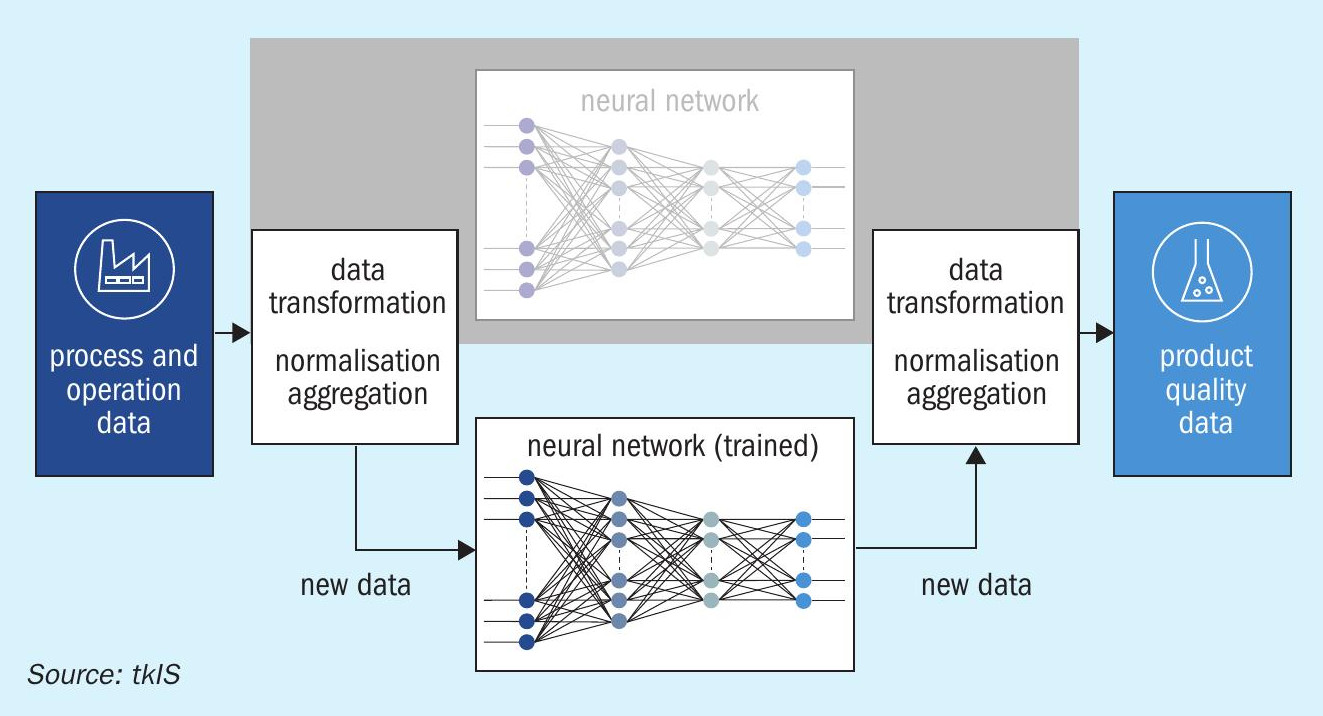
Its working principle is illustrated in Fig. 19. Input and output parameters each form a layer of variables which are linked with each other via intermediate variables in hidden layers. Each variable is influenced by each of the variables in the previous layer by a function (propagation function), containing fittable parameters.
ANN is applied in two phases, the training phase and the working phase.
First, in the training phase, known input and output data (historical data for online measured operating parameters and for product quality) are used to fit the internal parameters of the ANN in such a way that it accurately predicts these known output parameters.
Second, in the working phase, the previously determined internal parameters are fixed, and using the actual operating parameters as input, the product quality is predicted online.
thyssenkrupp Industrial Solutions is in co-operation with producers to implement such models. In one application, 93% accuracy has been reached (actual product quality within a confidence interval of prediction). The advantages are clear9 :
- no time delay to take corrective action if the product quality starts to deviate;
- less workload for the laboratory (if the ANN reliably predicts product quality is well above requirements);
- Better average product quality.
Case study 4
KPI generation and domain knowledge interpretation
Close monitoring of the plant condition is essential to achieve optimal performance. thyssenkrupp Industrial Solutions provides condition monitoring of plants including reporting and consulting services. The objective is to optimise the key performance indicators (KPIs) of the plant.
Analysis of the operating data is the basis for such services. The principle is shown in Fig. 20. Operating data is collected and stored at site by the thyssenkrupp data logger, which is connected to the plant DCS. Data exchange is achieved using standard interfaces, e. g. OPC UA, or specialised interfaces depending on the requirement at hand. The stored data can also be visualised in connection with a mobile device. The thyssenkrupp data logger is also a platform for future special purpose The concept of reports relies on the secure transmission of the plant data to the thyssenkrupp Internet of Things (IoT) cloud, where the aggregation and interpretation of the results is performed.
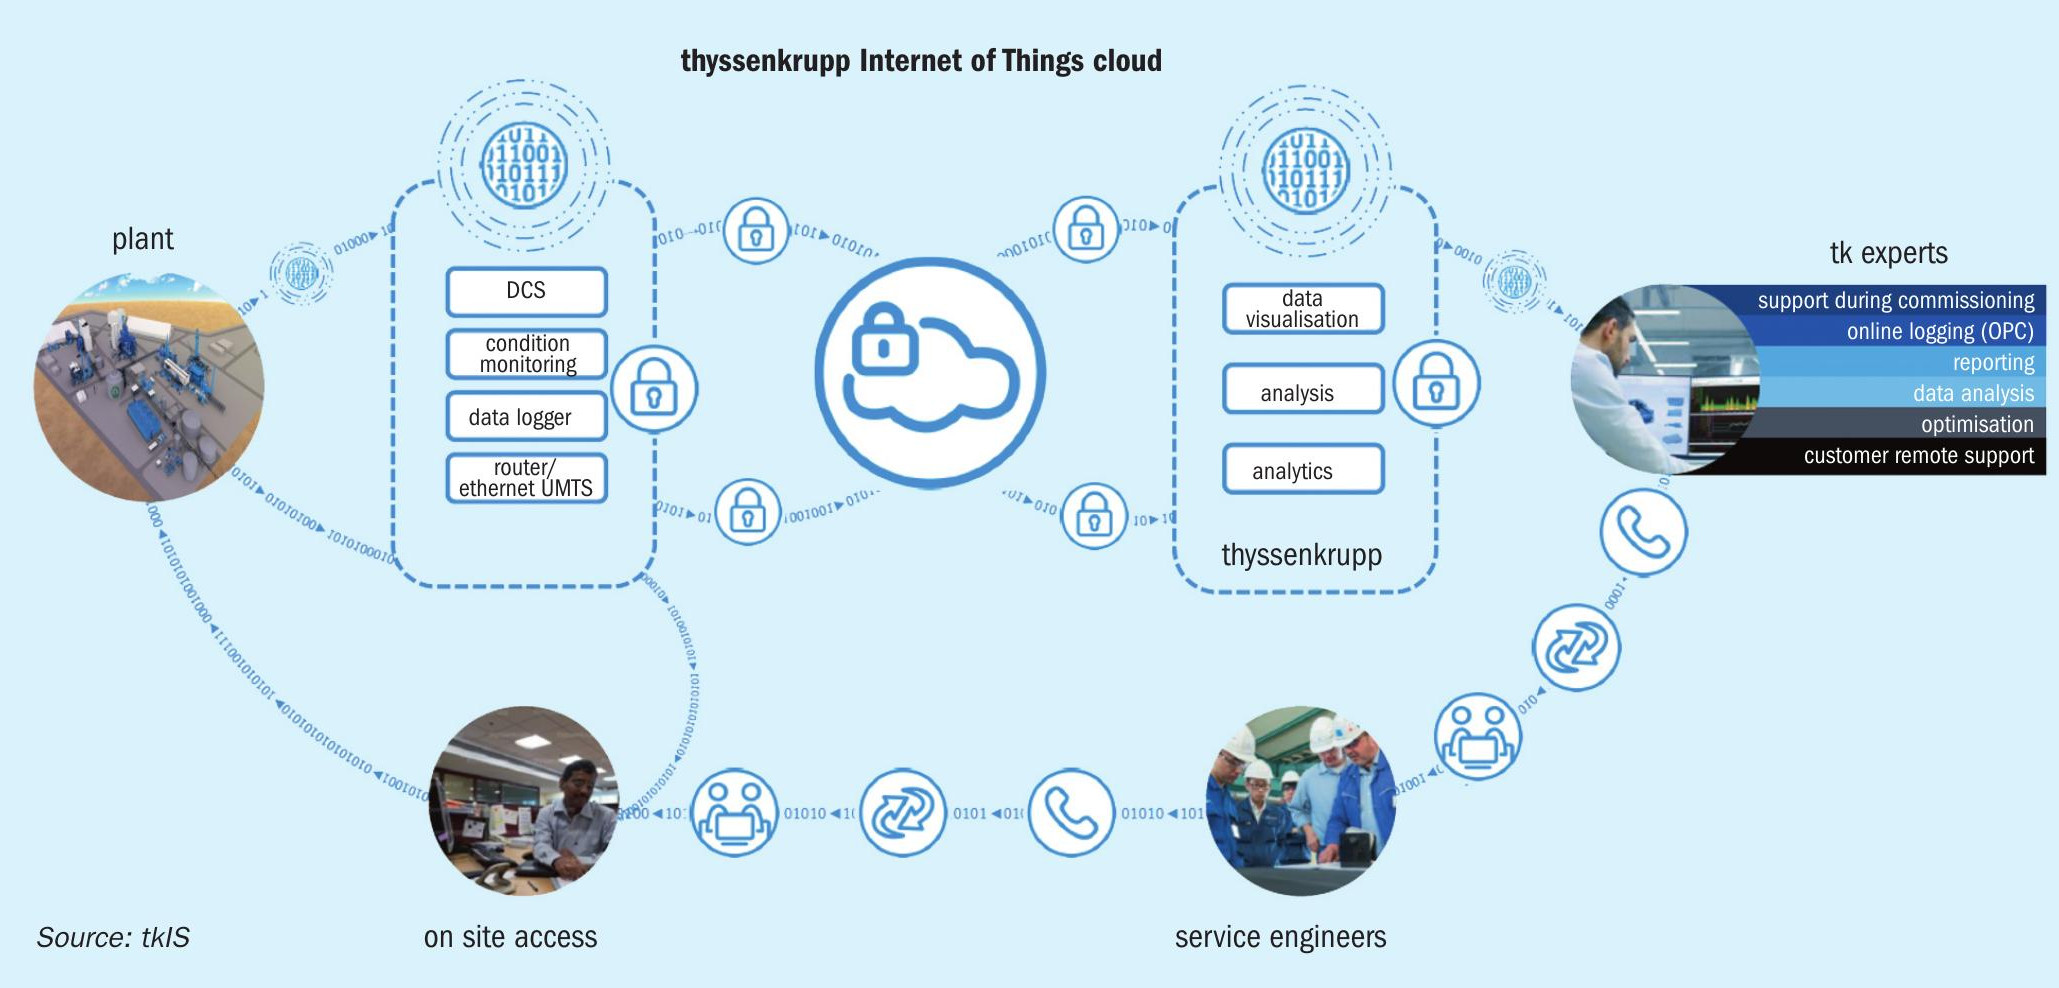
Analysis tools running in the cloud check the operating data and generate early warnings in case of unusual operating conditions. These analysis tools are developed in close cooperation between tkIS’ data scientists and technology experts and are fine-tuned by the input and according to the needs of the client. Typical KPIs investigated comprise high level KPIs like plant efficiency and feedstock/ utility consumption and more detailed KPIs like turbine efficiencies, catalyst performance, heat exchanger fouling rates etc. Comparisons of plant performance in the current year with the performance achieved in the previous year around the same time are also often requested by tkIS clients, enabling the client to spot subtle problems or benchmark successful revamps in a thorough and methodical way.
The data is analysed by tkIS technology specialists and data scientists on a regular basis and reports including visualisation of operating data, description of the plant status, documentation of findings and recommendations for operation and maintenance are prepared.
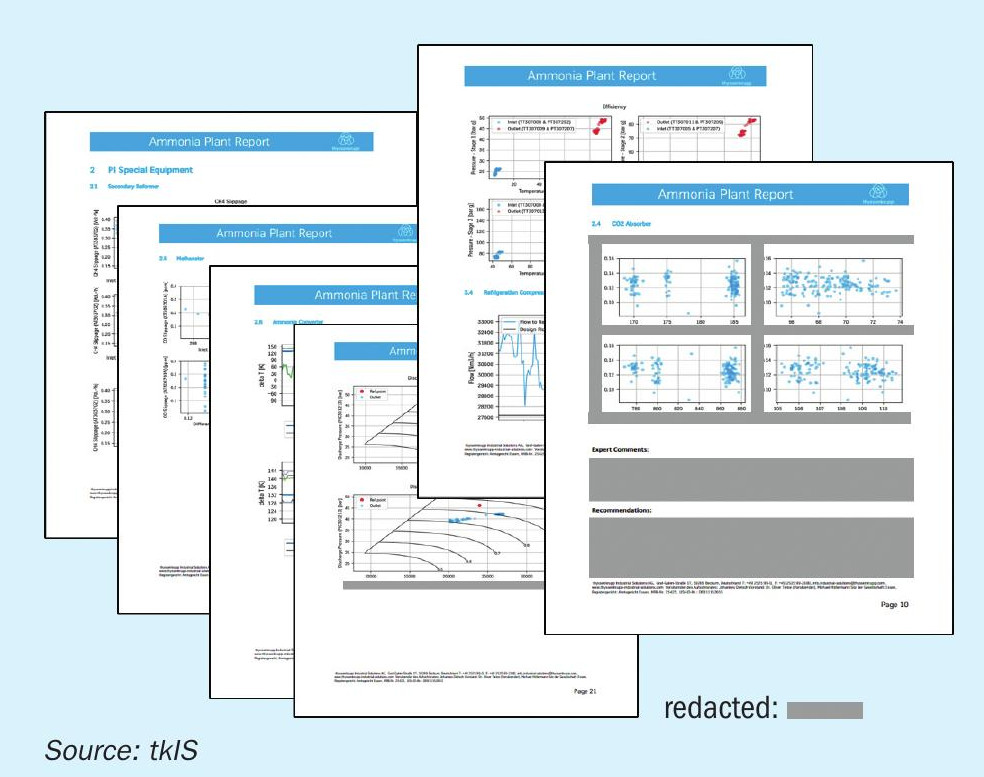
Fig. 21 shows some example pages from a typical report. As one can see, the visualisations are not only time series related but are selected with care from the tool box of the data scientists to maximise the information transported. The transport of the data to the cloud allows tkIS to use more sophisticated calculation mechanisms, including thermo-physical properties and in-house calculation models. In addition to these automatically generated figures technology experts analyse the data and can include comments and recommendations to optimise the performance of the plant.
Last but not least if the client agrees, tkIS can use the data in an anonymised form to compare the performance of the plant to similar plants and benchmark the plant’s performance against the best operating installations.
Operator training simulator (OTS)
thyssenkrupp Industrial Solutions trains operators and employees (trainees) in training sessions using a digital copy of a standard tkIS fertilizer plant. Using the plant simulator, the trainee can go through the start-up procedure from a cold state step by step. Secondly, he or she can learn how to react in critical situations, such as a failure of a critical equipment which can lead to a trip. In the best case, after training the operator can prevent a trip and feels more confident in difficult scenarios. A properly trained operator is key for the safe and reliable operation of the plant. Training performed with an OTS are analogues to flight simulators where pilots purposely train for hazardous and failure scenarios without a real risk, in order to be able to handle these scenarios optimally.
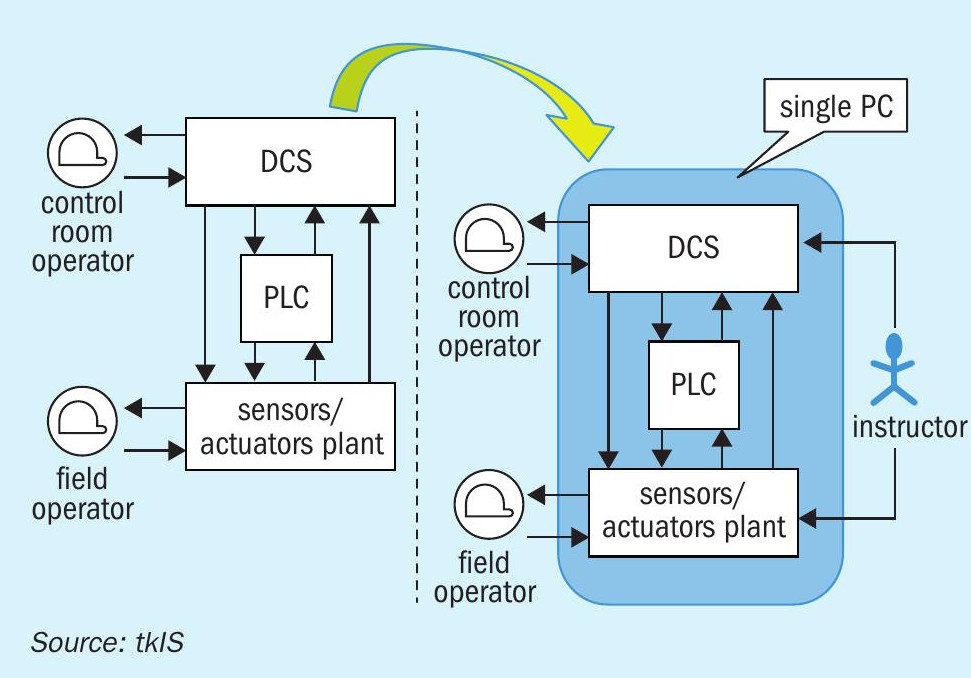
A very simplified scheme of the simulator is shown in Fig. 22. On the left hand side, the real plant including the real safety system (PLC) and the control system (DCS) is shown. Two specialised computers are normally installed to handle the data. Operators can influence the plant either through the hand valve in the field (visualised by the field operator) or by varying parameters in the DCS (shown in Fig. 22 as the control room operator). All these possible interactions are implemented in the training simulator shown on the right hand side in Fig. 22. The ammonia plant can be simulated and installed on one single computer. To train for different scenarios, a so called “instructor” can influence the parameters of the plant. For example, the instructor can force a pressure drop of the natural gas at battery limit conditions, start a failure of a part of the plant or change the surrounding conditions.
Anyone who wants to learn about the plant behaviour can sign in as a trainee. A trainee can interact with the simulated plant, similar to the real plant. The screen view mimics the DCS system. The position of every valve can be changed and, if it is a control valve, the set point can be changed. Every change leads to a different time-dependent behaviour of the plant including changes in the operating parameters such as temperature or pressure.
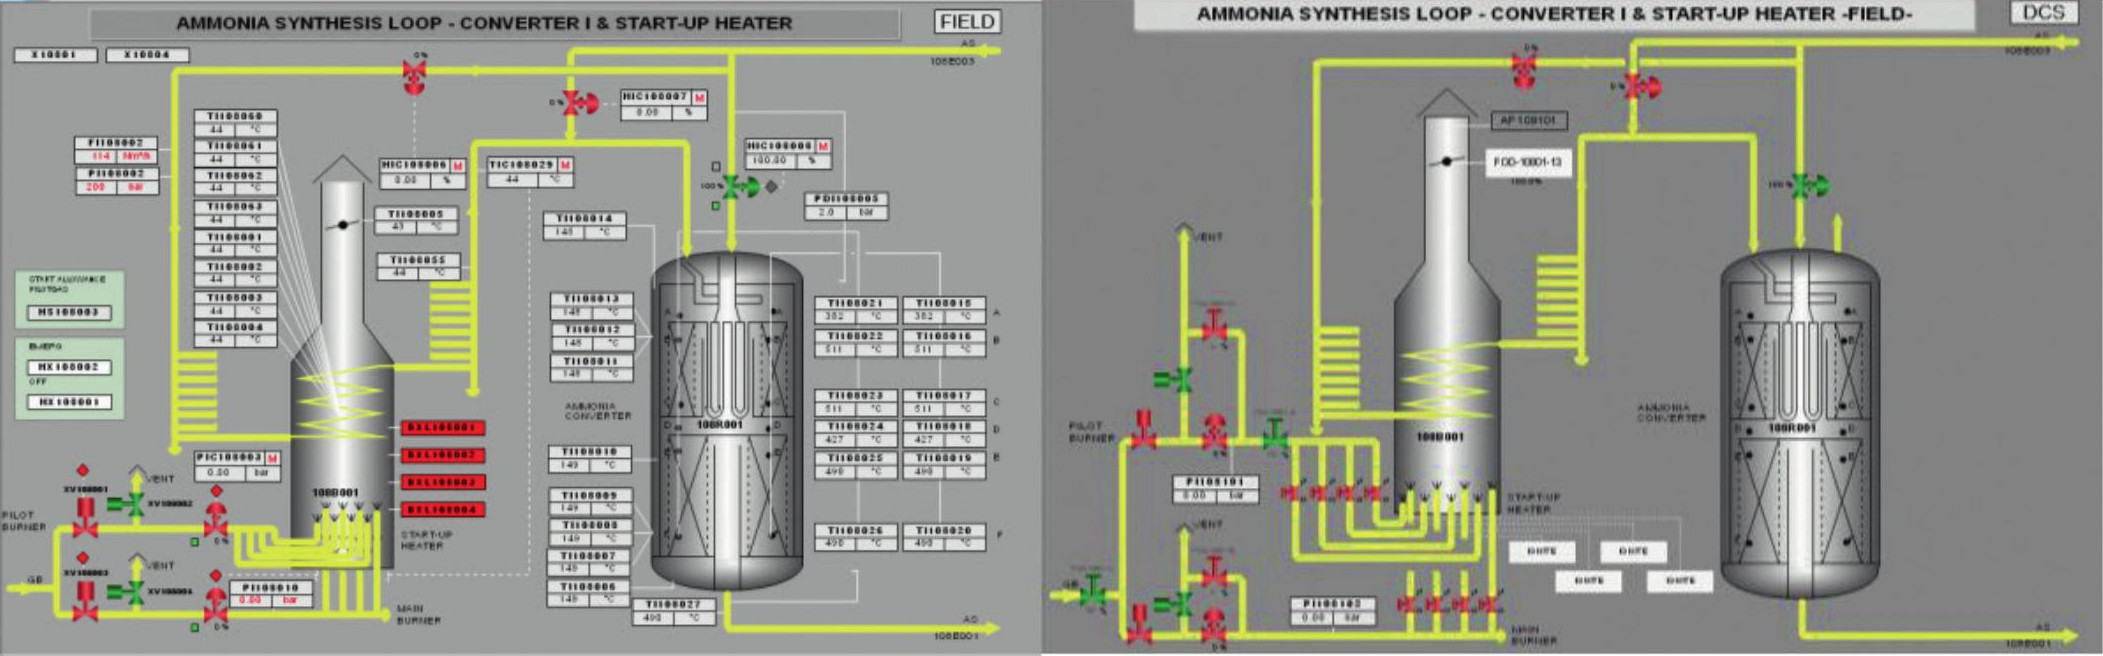
The trainee can switch between two different views. The DCS view closely mimics the design of a real DCS. Here, the trainee works like a control room operator as described above and can view the alarm list or the trip schedule. The second possible view is the so called “field view”. By switching to field view, the trainee can see all field instruments and operate all hand valves, too. These two different visualisations are shown in Fig. 23 showing the ammonia synthesis loop as an example.
A more advanced solution for field operator training might also be based on a virtual 3D environment, which tkIS is able to develop in cooperation with a company specialised in this regard on request of the client. This 3D environment is based on the 3D models already created during the plant construction phase and offers the ability for a deeper level of immersion. The training can be performed individually or several trainees can connect with their electronic device to one plant simulation. Tasks can be split among the group of trainees and the communication between the field operator and the operator in the control room can also be practised. The training sessions have different levels of complexity, starting with an easy level for beginners. One additional option of the OTS is to practice the tuning of the controllers.
The goal of the operator training system is to train the operator to be more confident in challenging scenarios, equipping the operator with the knowledge and training to prevent trips, optimise the plant considering the most important impacts and handle the tuning of controllers.
tkIS has prepared standard training procedures for the different levels of complexity, but is also able to adapt the training program based on the client’s needs.
The simulator can provide benefits to fertilizer plants such as ammonia, nitrate or nitric acid plants.
References