Nitrogen+Syngas 370 Mar-Apr 2021
31 March 2021
A turbulent year
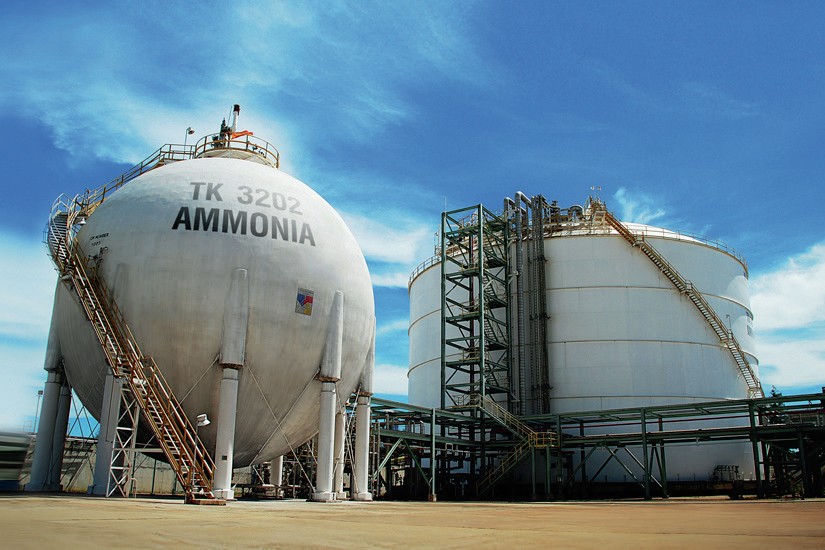
AMMONIA
A turbulent year
Shutdowns in technical ammonia capacity due to the pandemic have contributed to make 2020 a turbulent year for ammonia markets, but plant shutdowns, strong fertilizer demand and a shortage of new merchant ammonia capacity are contributing to finally removing the burden of overcapacity.
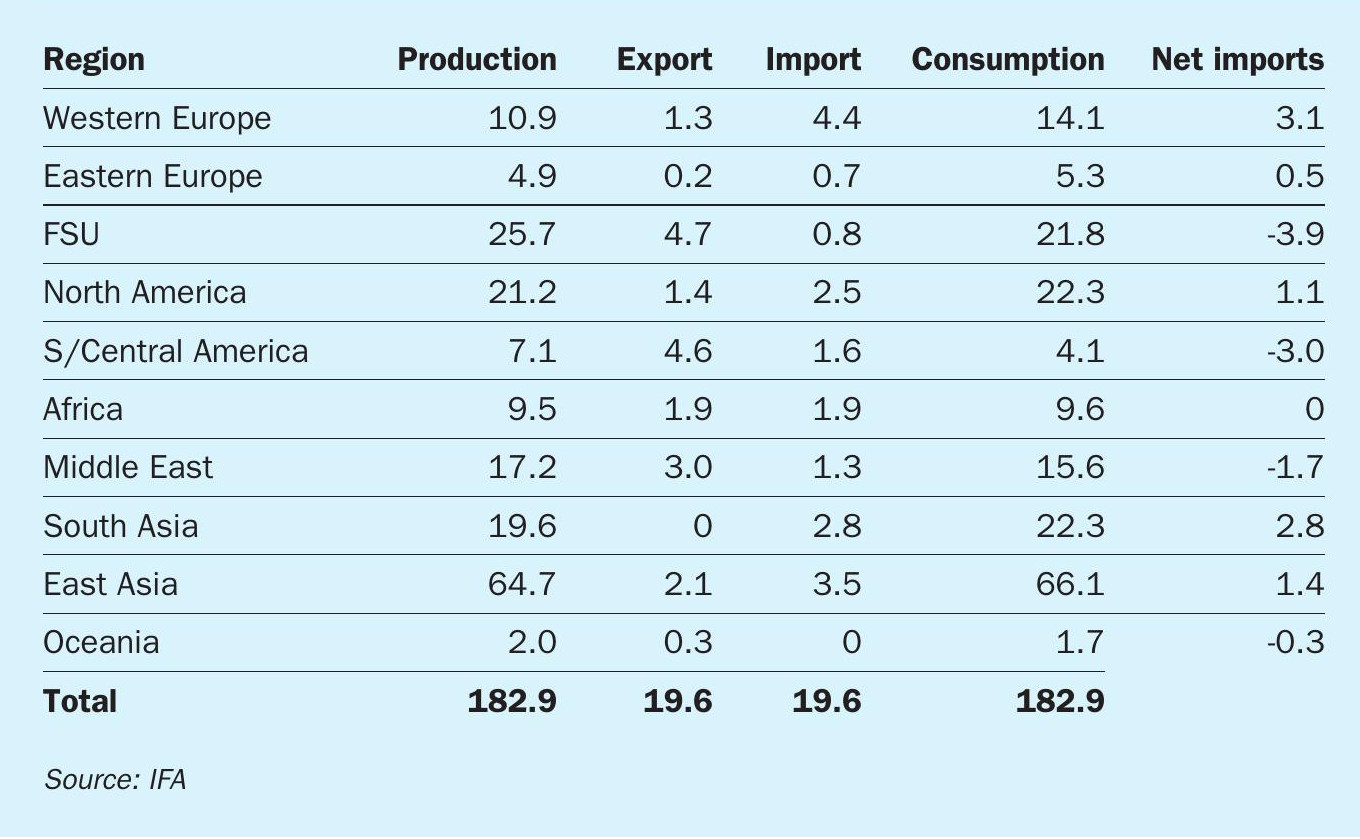
Ammonia remains the second largest industrial chemical by tonnage, and global production and consumption continues to rise. As Table 1 shows, in 2019 this reached 183 million t/a, which was up 2% on the previous year, but CRU estimates that ammonia production rose by 4% to 190 million t/a in 2020 in spite of the impact of Covid. As a result, ammonia utilisation rates have been climbing from the low point of 79% that they reached in 2017-18 back towards 83%.
Since most ammonia is consumed at the point of production in the downstream manufacture of urea, nitric acid or various nitrates, the merchant market for ammonia remains only a small fraction of this total, however, representing around 11% of production, or 19.6 million t/a in 2019 (itself down 0.4 million t/a on 2018), and the full figure for 2020 is likely to be much the same as for 2019 or slightly lower (19.5 million t/a) in spite of the rise in overall ammonia production – most of the new ammonia production in 2020 was used in downstream urea plants.
Ammonia production capacity is split between downstream fertilizer and industrial demand, with the former use accounting for about 75% of production. Industrial or ‘technical’ demand represents the use of ammonia as a feedstock for production of various industrial chemicals such as caprolactam (for fibre production), acrylonitrile, adipic acid, isocyanates (for polyurethane production), and low density (explosive grade) ammonium nitrate. Caprolactam production consumes 5 million t/a of ammonia, acrylonitrile about 3 million t/a, and hydrogen cyanide production about 500,000 t/a.
Because of higher value end use products, industrial consumers can often pay higher prices for ammonia and so are able to buy ammonia on the merchant market. The same is also true for ammonium phosphate fertilizer producers, which clusters in regions that mine phosphate rock and may not have access to domestic ammonia production. For this reason, technical ammonia and MAP/DAP producers dominate merchant demand for ammonia, although a small amount is imported by urea and ammonium nitrate producers in regions with relatively high domestic gas costs which makes local ammonia production less economic, such as southern Africa.
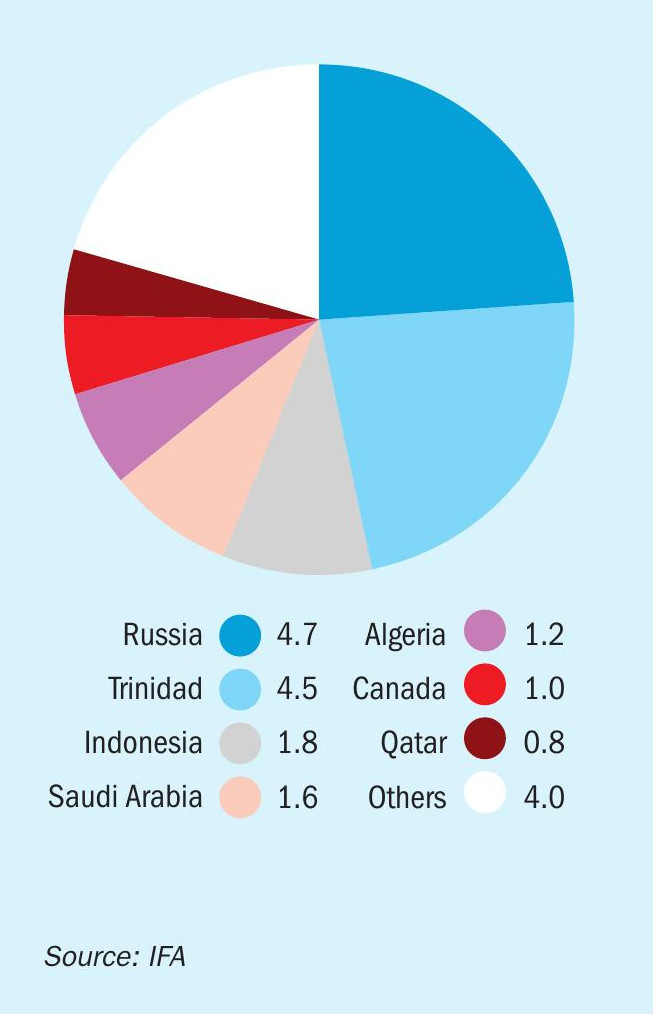
Geography of supply and demand
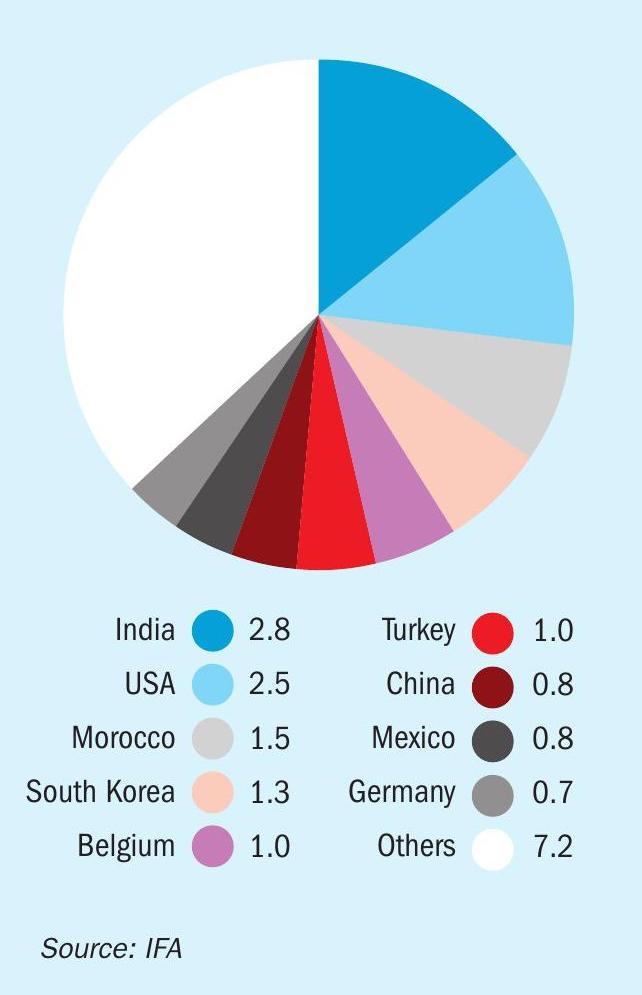
Figure 1 shows the location of merchant ammonia production capacity. It is concentrated in relatively low gas cost locations with goods access to ports, and is dominated by Russia, Trinidad and the Middle East. It is also relatively concentrated in terms of suppliers – seven countries were responsible for 80% of all ammonia exports in 2019. Demand, however, is much more diffuse. Figure 2 shows the comparable destinations for merchant ammonia. The top nine importing countries represented only 60% of global ammonia imports in 2019. India, the USA and Morocco all import ammonia for domestic phosphate production, Korea, Belgium and Germany for industrial chemical production.
However, the relative importance of these producers and consumers continues to change. The US used to be a much larger importer of ammonia, for example, buying nearly 8 million t/a in 2012, but domestic production has revived as cheap natural gas became available because of the surge in shale gas production. Conversely, Trinidad has struggled with gas supply constraints. Russian exports of ammonia have been rising rapidly in recent years, increasing by 38% just from 2017 to 2019.
Trinidad
When gas costs were higher in the US during the 1990s, Trinidad became the favoured location for new ammonia production supplying to the US market as US domestic production in the Gulf Coast closed down. Trinidadian ammonia exports peaked at 5.3 million t/a in 2012. Since then there has been a long slow decline, mainly due to a contraction in US demand as domestic production recovers, and a lack of availability of natural gas. The cost of natural gas has also become a major issue for the island, with the price paid by industrial consumers – mainly ammonia and methanol exporters – set at a lower level than the cost of developing new gas fields. This puts Trinidad’s government, which buys gas from local gas producing companies via the Natural Gas Company of Trinidad and Tobago (NGC) and sells it on to downstream producers in a dilemma. If it raises gas prices to the cost of developing new gas fields (a figure of $4.00/MMBtu has been discussed), then it may kill off the ammonia and methanol industries that are the main consumers of that gas. However, if it keeps on supplying gas at the current rate, then the current gas fields will gradually run down. For the past few years NGC has found itself unable to supply 100% of the gas requirements of the various producers on the island and has been rationing gas allocations. This is leading producers to gradually close down production. Nutrien, which operates four 600,000 t/a ammonia plants on the island, idled two of them in May 2020, and has since said that one of them will close permanently. Yara closed one plant in December 2019, and has been operating another line at significantly reduced capacity. Trinidad exported 4.5 million t/a of ammonia in 2019, but the closures and cutbacks have reduced this by about 20% in 2020.
North Africa
The major development in North Africa is the continuing expansion of OCP’s phosphate production at its three sites in Morocco. While the timeline of the company’s massive pipeline of new MAP/DAP plants has slipped a couple of times, it is still in the middle of a massive expansion. There is not sufficient gas available in Morocco to run the required additional ammonia production, so Moroccan imports have increased, from 0.3 million t/a in 2008 to 1.5 million t/a in 2019. Current proposed projects will require another 1.2 million t/a. Further east, Algeria has been expanding its merchant ammonia exports accordingly, from 0.5 million t/a in 2008 to 1.2 million t/a at present.
Russia
Cheap gas and rising domestic demand for fertilizer is leading to something of a boom for Russian nitrogen production. On the merchant side, EuroChem commissioned a new 850,000 t/a ammonia plant at Kingisepp, near St Petersburg in 2019, with 250,000 t/a of the output earmarked for EuroChem’s downstream industrial production in Antwerp, Belgium, as well as domestic ammonium phosphate production, and the company’s Lifosa operations in Lithuania. This took Russia’s ammonia exports to 4.7 million t/a in 2019, making it the largest exporter of ammonia in the world.
There are several major new downstream urea, urea ammonium sulphate and ammonium nitrate plants under construction in Russia, but a number of them have no associated ammonia production, and will in fact absorb some of Russia’s ammonia surplus, leading to lower availability once the plants come on-stream in 2022-23.
Middle East
The Middle East is the third major ammonia exporting region after Russia and Trinidad. Much of its capacity grew on the basis of what was at the time cheap, ‘stranded’ natural gas in the 1980s and 90s. However, the rapid urbanisation of the region has led to an equally rapid rise in domestic demand for natural gas to generate electricity, and while existing producers, mainly state owned, are still on cheap gas contracts from domestic oil/gas companies, new gas can be quite expensive, especially sour gas developments in Abu Dhabi and Saudi Arabia. Saudi Arabia is also developing its own domestic phosphate industry to try and diversify its economy away from oil. Although Saudi Arabia builds its own gas-based ammonia capacity to supply these MAP/DAP plants, differences in project timing from the start-up of these plants can mean that at times for a year or so Saudi Arabia is exporting large volumes of ammonia.
Elsewhere, Iran exported 1.1 million t/a of ammonia in 2010, but over the past few years has been dogged by US sanctions over its nuclear programme. Iranian ammonia exports fell to 0.3 million t/a in 2019. China has become the main buyer of Iranian ammonia, some of this destined for re-export, but Chinese import requirements for ammonia are relatively modest.
In Oman, some relatively small new merchant ammonia capacity will start up in May 2021 with the new 330,000 t/a Salalah Methanol ammonia plant.
Covid
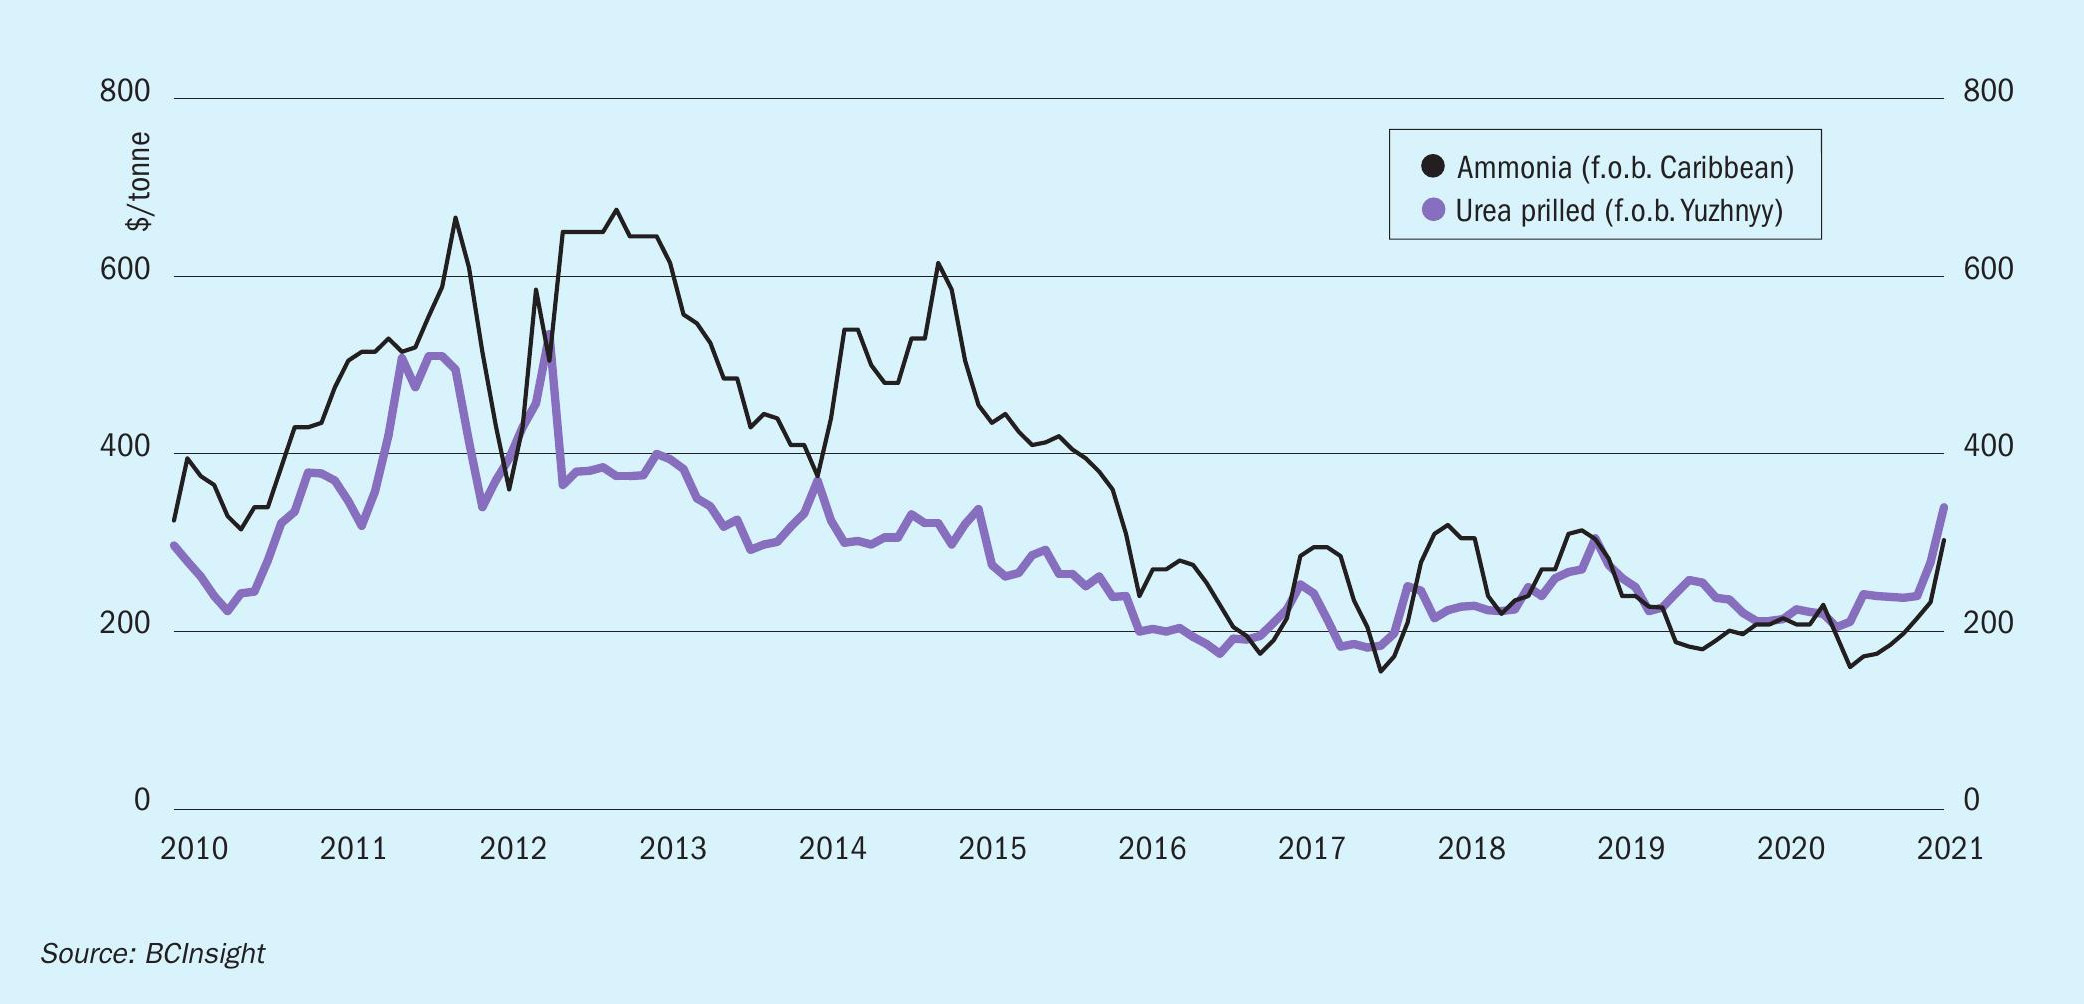
The Covid-19 outbreak has naturally had an impact on the ammonia market. In particular, lockdowns in China, Europe and the US affected industrial demand for ammonia in particular. At the same time, very low natural gas prices, especially in Europe, have allowed ammonia producers to keep operating, albeit sometimes at low margins. The result has been continuing weakness in the ammonia market, in spite of intermittent operating problems that have removed merchant capacity from the market. Prices have remained relatively low, as Figure 3 shows.
Global GDP fell by 4.4% in 2020, and this has had a corresponding effect on industrial ammonia demand, although a 5.8% fall in GDP in advanced economies was slightly balanced by a 2% increase in Chinese GDP and 3.3% in developing economies. Conversely, agricultural markets had a good year in 2020, as most governments have treated this as a priority sector and given it considerable support. Crop prices have also been good, which has helped support farmers’ buying of fertilizer. Nitrogen fertilizer demand rose 1.7% in 2020. India in particular had a bumper application year, and bought large tonnages of urea. All of this has helped to increase overall ammonia production, as noted earlier, to 190 million t/a. However, it has not significantly impacted the merchant market, as increases in ammonia demand for phosphate production was balanced by reductions in demand for industrial end uses.
Tightening supply
In general the ammonia market remains oversupplied. The merchant market saw a major increase in capacity in 2018-19 and demand, adversely affected by the pandemic is still catching up. However, various factors are likely to see the market tighten over the next few years. In February this year markets had a shock when winter storm Uri descended on the United States, reaching as far south as Texas, and removing power to many fertilizer plants for a couple of weeks. The dislocation in production led to a flurry of US import demand for ammonia, at the same time that several plants were down with production difficulties.
It is likely that as the global vaccination programme continues and covid-related restrictions are gradually eased into the second half of 2021, so industrial demand for ammonia will increase again. At the same time, there are few new merchant ammonia plant additions on the horizon, and some new downstream plants that will remove capacity. The oversupply in the ammonia market is therefore likely to ease over the next couple of years and prices will begin to rise again from the floor that they saw over the past few years.
Looking to the longer term, there are two developments that may begin to impact upon supply and demand further into the decade. Firstly, there is increasing interest in the use of ammonia as a fuel, especially for shipping. In theory, ammonia can be burned to generate only nitrogen and water, and thus is a relatively ‘clean’ fuel, albeit one that has major challenges relating to storage and handling. The shipping industry is looking towards a potential phase-out of hydrocarbon based fuels towards 2050, and is seriously examining ammonia as a potential candidate for a replacement.
Of course, to be used as a ‘clean’ fuel, the ammonia would need to be produced using ‘green’ sources, as we discuss in our article elsewhere in this issue. While at the moment most green ammonia projects are at a pilot or demonstrator scale, Yara has recently announced that it will be progressively switching production at Porsgrunn to electrolysis-based hydrogen, and this is sure to be a growing change in the industry going forward, possibly returning ammonia capacity to places such as Europe where it has atrophied over the past few decades as ammonia moved to where gas was cheap.
This development may also lead to demand for ammonia as a way of storing and transporting hydrogen for a future ‘hydrogen economy’. Japan in particular is interested in this development and is working with some renewable ammonia projects in Australia and other places to test the viability of this. For the moment, however, natural gas based production will continue to dominate the industry.