Sulphur 395 Jul-Aug 2021
31 July 2021
The three “Ts” reconsidered
CLAUS UNIT AMMONIA DESTRUCTION
The three “Ts” reconsidered
Are the three “T”s (temperature, turbulence, time) of Claus unit ammonia destruction still meaningful with improved understanding of the thermal reactor? CFD models appear to be adequate at higher temperatures, e.g. 1,200°C, but not at lower temperatures, e.g. 800°C and 1,000°C. A. Keller, on behalf of the Amine Best Practices Group, reviews how meaningful the rules of thumb for Claus unit ammonia destruction really are.
There is a near ad-nauseum collection of technical papers concerning the destruction of ammonia in Claus thermal reactors (as reaction furnaces are now being called). There have been arguments for the use of “oxidising” conditions in “front zones” of the thermal reactors while others have maintained that oxidising zones encourage the formation of sulphur trioxide causing plugging in downstream equipment. Papers abound advocating split furnace zones or “good mixing” burners. Ultimately, nearly all of these papers get to the same rules of thumb for adequate ammonia destruction in a Claus burner/thermal reactor:
- lTime: 0.8-2 seconds of thermal reactor residence time is needed;
- Temperature: 1,200-1,250°C (2,1922,282°F) is the minimum temperature requirement;
- Turbulence: Mixing in the burner and furnace need to adequately combine the air and acid gas being burned.
Known as the three “Ts” for good ammonia destruction, they have been considered close to gospel for the practitioners of Claus sulphur recovery, but they unfortunately rest on some fairly shaky assumptions.
Concerning residence time, most chemical engineers would compute this simply as the volume of the thermal reactor space divided by the volumetric rate of the gases through the reactor as if this were merely a turbulent flow in a pipe exercise. As we shall see later on, this is not meaningful for the bulk flow of gas in the burner/thermal reactor, nor is it meaningful in terms of how the ammonia destruction takes place.
Concerning temperature, most operations departments rely on pyrometers peering into or embedded thermocouples indirectly reporting a value purporting to be the temperature in the thermal reactor. We shall also see this number may not be meaningful in terms of how the ammonia destruction takes place.
Concerning turbulence, it is presumed that better mixing bringing oxidiser and fuel together improves ammonia destruction. It is up to each Claus burner/thermal reactor technology provider to convince each potential client that their burner/thermal reactor design is best suited to this task. We shall also see where some technology offerings have been criticised, but fortuitous design circumstances allowed these technologies to perform adequately.
Most of the shaky assumption blame can be placed squarely on the industry’s lack of digital computing power prior to the 1990s. With the advancement of solid-state electronics through the 1980s into the 1990s, computing speed increased exponentially. Chemical engineers now had the computing power to make computational fluid dynamic (CFD) modelling practical.
Models have moved from around 30 thousand cells for a Claus burner/thermal reactor to over 30 million cells. With the details that these models can develop, is it worth asking if the gospel notions of the three “Ts” are still worthy of their gospel quality?
Temperature and composition effects on ammonia destruction
The landmark study by Alberta Sulphur Research Limited (ASRL) on the chemical conversion of ammonia in Claus thermal reactors in the late 1990s1 corrected many of the known rules of thumb of that day concerning ammonia destruction. What is being discussed in this work is not meant to change or alter any of the conclusions made in their analysis, but to put their results into the perspective of burner/ thermal reactor performance and to reconsider the three “Ts” rules of thumb.
Some important conclusions from the ASRL work that are useful for understanding CFD models of different burner/thermal reactor systems can be summarised as:
Reduction of SO2 by ammonia to form nitrogen, water, H2 S, or elemental sulphur is kinetically favoured over thermal decomposition of ammonia to nitrogen and hydrogen or direct oxidation of ammonia by oxygen.
Above 1,200°C, the kinetics of SO2 reduction by ammonia results in nearly complete ammonia destruction in much less than one second residence time.
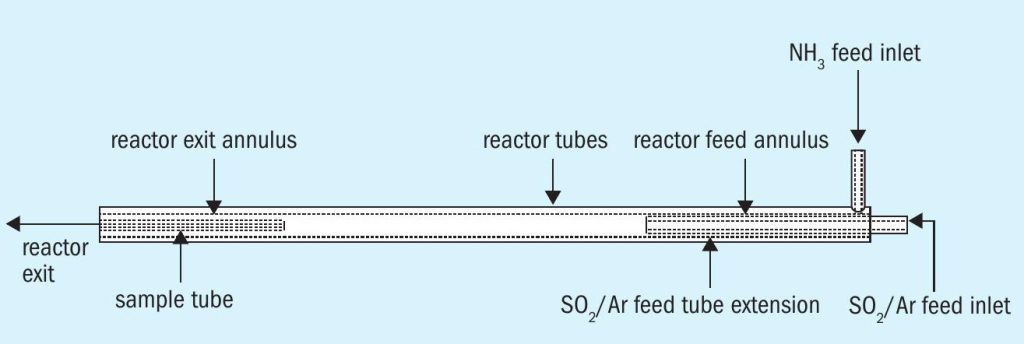
Fig. 1 is a schematic, provided by ASRL to a member company, of the tubular reactor placed in a temperature-controlled furnace to perform this study. The geometry of this reactor was used by the member company to construct a CFD model of the reactor to validate the turbulent, plug-flow assumption used to determine experimental residence time used to correlate conversion.
The experiment was conducted with some fixed assumptions, plug flow and isothermal conditions. The CFD modelling fixed assumptions were the mixing parameter and all reactions having achieved chemical equilibrium inside of any of the differential cells being computed.
Let’s examine some of the modelling results testing both sets of assumptions.
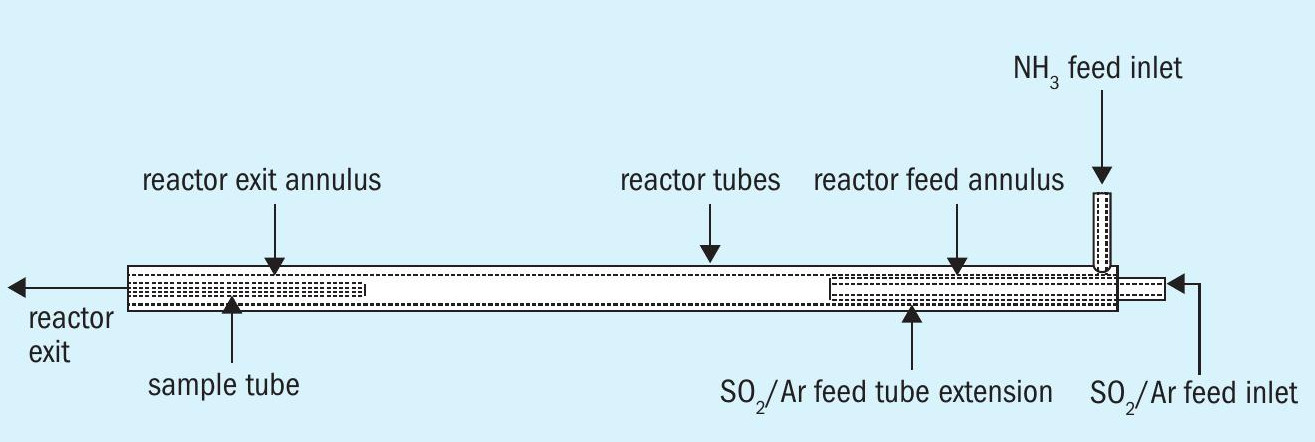
Fig. 2 is a comparison of yields of various species measured in the lab versus those predicted by the CFD model. The cases were run to try to match the residence times computed from the laboratory work showing a small discrepancy. At the lower temperature, the CFD assumption of achieving equilibrium is invalid according to the measured results. At the higher temperature, the CFD assumption of reaching equilibrium is fairly consistent with measured results.
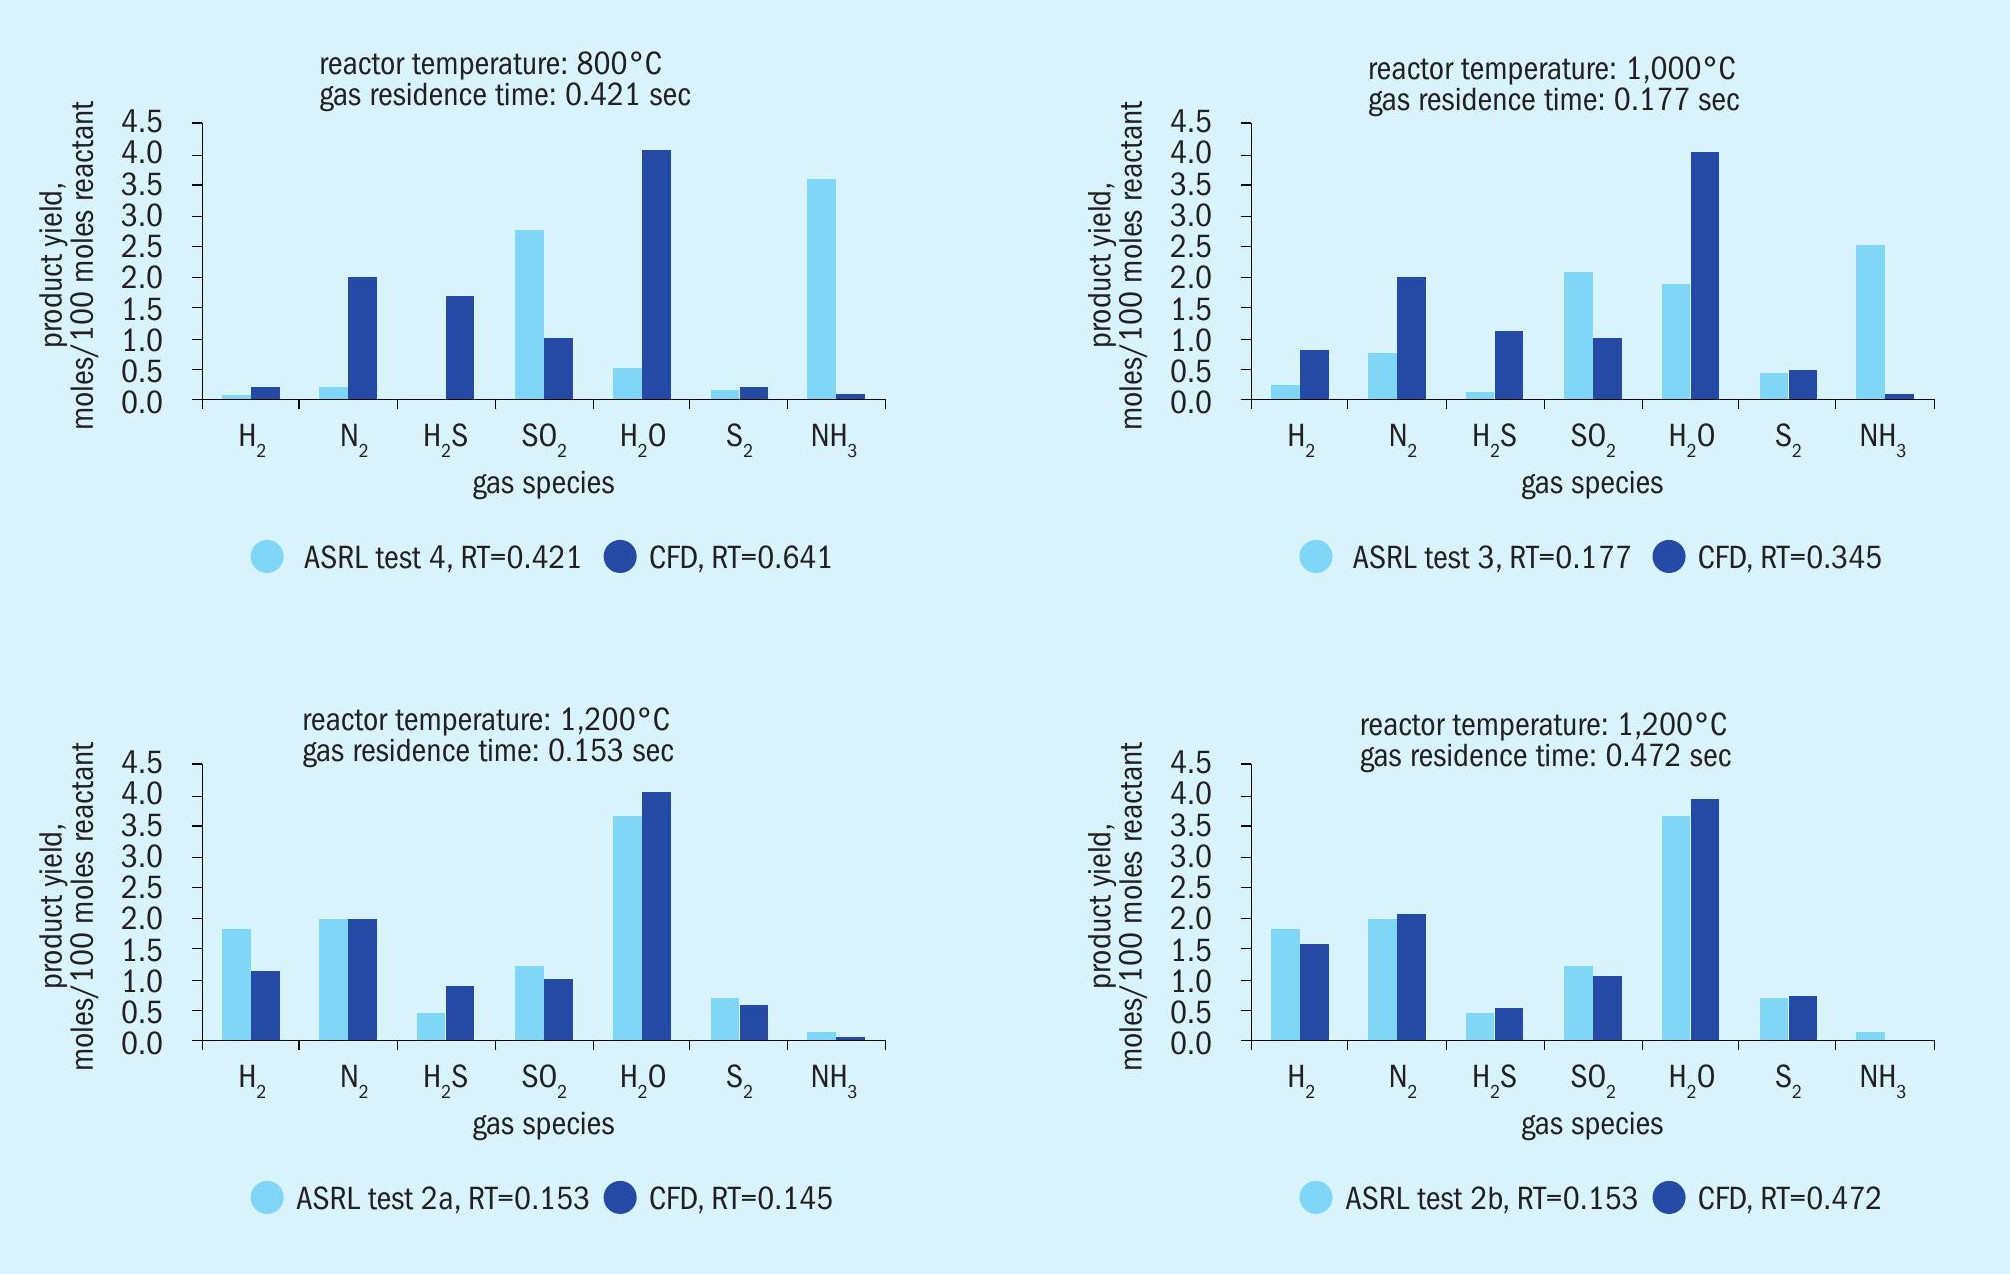
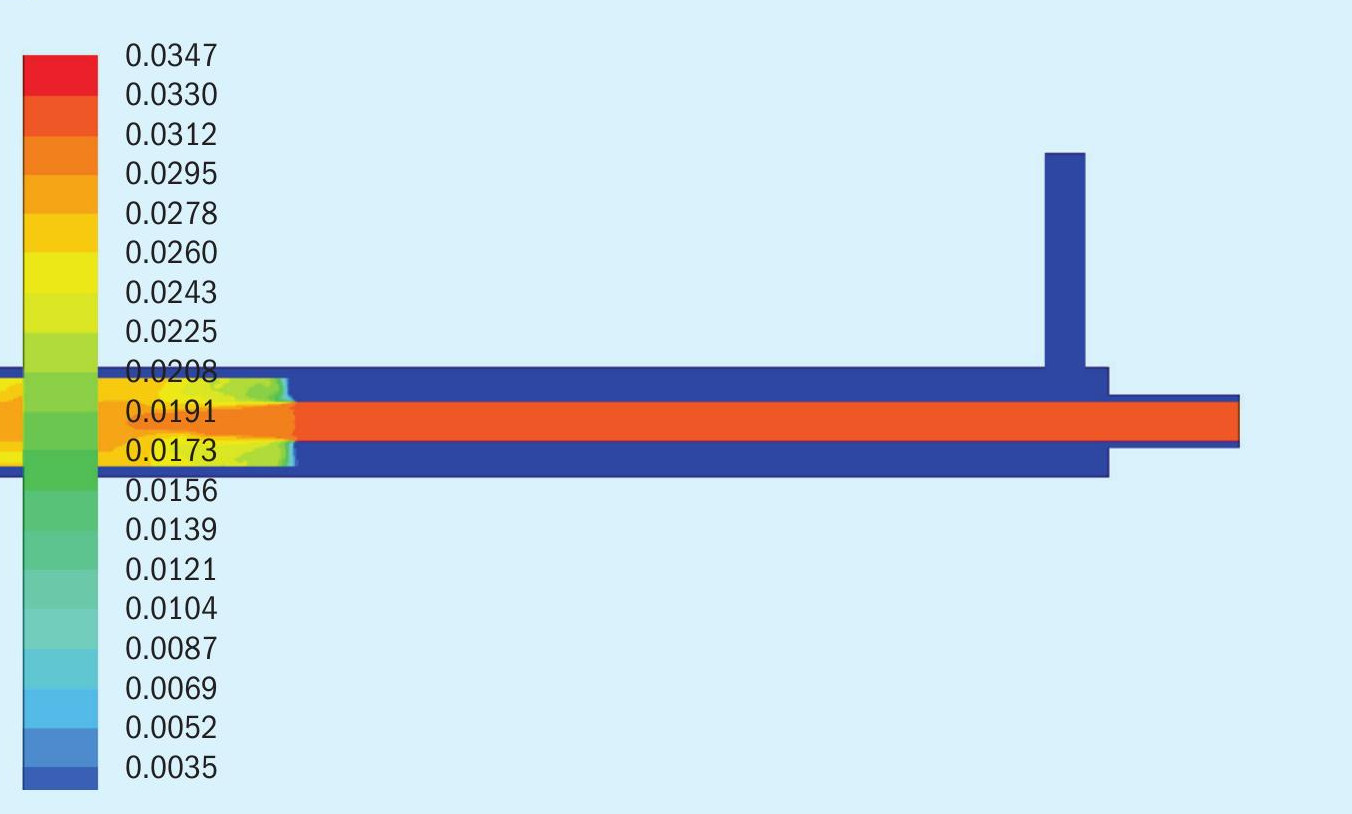
In Figs 3, 4 and 5, we see three data extractions from the model depicting the reactor temperature profile, ammonia concentration profile, and SO2 concentration profile for Test 2a.
In Fig. 3, temperature is shown in kelvin (K). 418K is 144°C or 293°F, depicted by the blue colour at the bottom of the scale. 1,472K (1,119°C or 2,190°F) as depicted by the reddish orange colour near the top of the scale is the furnace and outer tube temperature. Ammonia, entering the annular space closest to the heating source on the outside of the reactor tube wall, is heated more rapidly than the Ar-SO2 mixture entering in the middle tube.
In Fig. 4, the scale on the side shows the ammonia concentration in the inlet and the change in concentration as the ammonia is first heated then reacted. The rapid heating of the ammonia without water being present leads to some thermal decomposition as the ASRL study showed in a separate experiment. Reaction of the remaining ammonia with SO2 is fairly rapid when the two streams are combined and reach 1,286K (1,013°C or 1,855°F) to 1,348K (1,075°C or 1,967°F).
In Fig. 5 the scale depicts the mole fraction of SO2 in the Ar-SO2 mix dissipating as it contacts the ammonia in the reaction zone. The Ar-SO2 mix is being heated more slowly than the ammonia, but the heating does nothing to the stable SO2 molecule. At the point of mixing with the hot ammonia, SO2 is rapidly consumed.
Unlike the confirmation of the chemical reaction results obtained in the laboratory, the CFD modelling dispels some of the three “Ts” assumptions. We certainly don’t have plug flow. Not everything is perfectly mixed and at a constant temperature, and near complete destruction is taking place below 1,200°C. Most importantly, ammonia appears to react quickly near the mix point and does not require the entire residence time of the tube.

CFD application in commercial units
We can apply these small-scale lessons learned to commercial-sized burner/thermal reactor systems. The emphasis in doing this must be kept on the notion of the three “Ts” and their application to the burner/thermal reactor design.
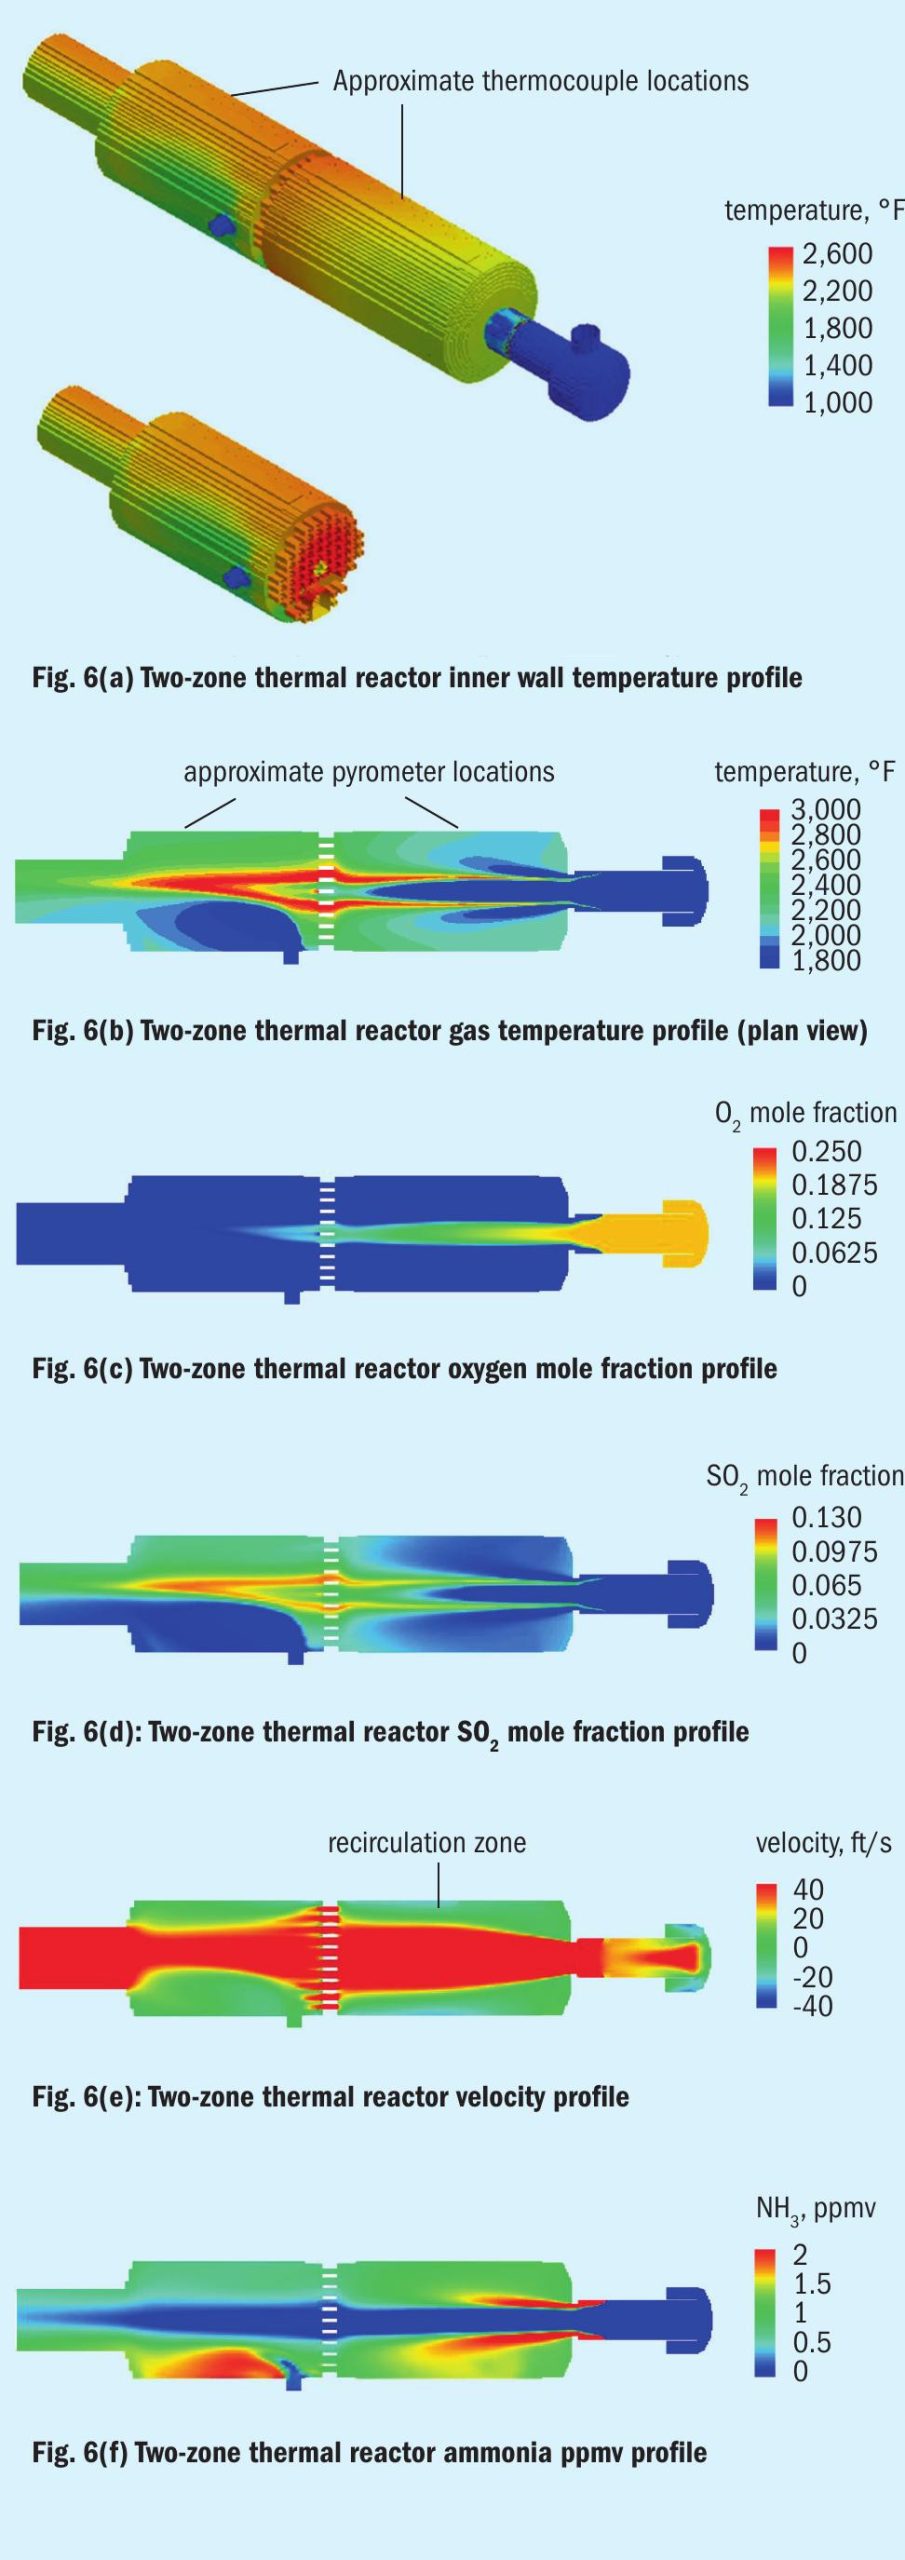
We will examine two well-known technology offerings. The first is a low mixing intensity burner with a two-zone thermal reactor using amine acid gas split between the two zones (see Fig. 6). The second will be the single-zone thermal reactor using a high mixing intensity burner (see Fig. 7).
For each offering, there are six images extracted from the CFD models done. These are wall temperature, gas temperature, oxygen mole fraction, SO2 mole fraction, ammonia ppmv, and velocity.
Low intensity mixing burners
In Fig. 6b we see that the first zone, which is supposed to be hotter than the second zone is much cooler, on average. What is most important to note is that ammonia contained in the acid gas is being heated up by hot gas recirculating in a narrow annular space prior to contact with the SO2 generated by the combustion.
In Fig. 6f, note that the scale was to primarily show low values for completeness of destruction purposes. Regions in red represent higher concentrations.
Burning with excess air would give a hotter flame as more H2 S is converted to SO2 and water in a highly exothermic reaction. However, the profiles show that if a box were drawn around the first zone (assuming perfect mixing), technically it would be an oxidising environment. However, we see that oxygen leaves the first zone only because it remains unmixed.
Next, we notice that SO2 is plentiful where the acid gas and air are mixing and burning, but not so plentiful in the recirculation zone of first thermal reactor zone. SO2 made in the initial flame is rapidly consumed to make sulphur and water by reacting with H2 S. It also appears from the ammonia concentration profile that SO2 is also aiding in ammonia destruction close to where the incoming acid gases and air collide.
Without the benefit of CFD modelling, a prescient conclusion/recommendation from the ASRL work clarifies this:
This study has, however, shown that SO reacts quite readily with ammonia forming N , water or H , and sulphur or H S, displaying reaction rates which exceed those of either dissociation or oxidation. Also, it was shown that the ammonia/SO reaction is able to proceed in the presence of water. These observations and others described in the main text suggest the following protocol for ammonia destruction in the Claus furnace.
- Utilise a burner/furnace configuration which allows the SWSG to impinge on a hot SO -rich flame. 2
- This could be accomplished by feeding all the oxygen required for ammonia and H S conversion with the AG through a main burner with the SWSG impinging on the flame. 2
What we have here is a “which comes first, the chicken or the egg?” scenario. The burner/thermal reactor that was modelled was vintage 1980, the ASRL work was done in 1998, and the CFD modelling was done in 2007. The burner/thermal reactor was destroying ammonia effectively for almost two decades prior to the ASRL work, yet it implemented the ideas developed from the study. CFD modelling showed the burner/thermal reactor designed using the three “Ts” philosophy did not work exactly according to the three “Ts” rules, especially time and turbulence, but it still did the job.
Let’s look at the last suggested protocol from the ASRL work now.
- Employ furnace temperatures exceeding 1,250°C and furnace residence times of >1.5 sec.
Without the benefit of CFD done on the laboratory reactor (late 2012), this conclusion was likely the result of making the assumptions of plug flow/perfect mixing and somewhat genuflecting to the three “Ts”.
High intensity mixing burners
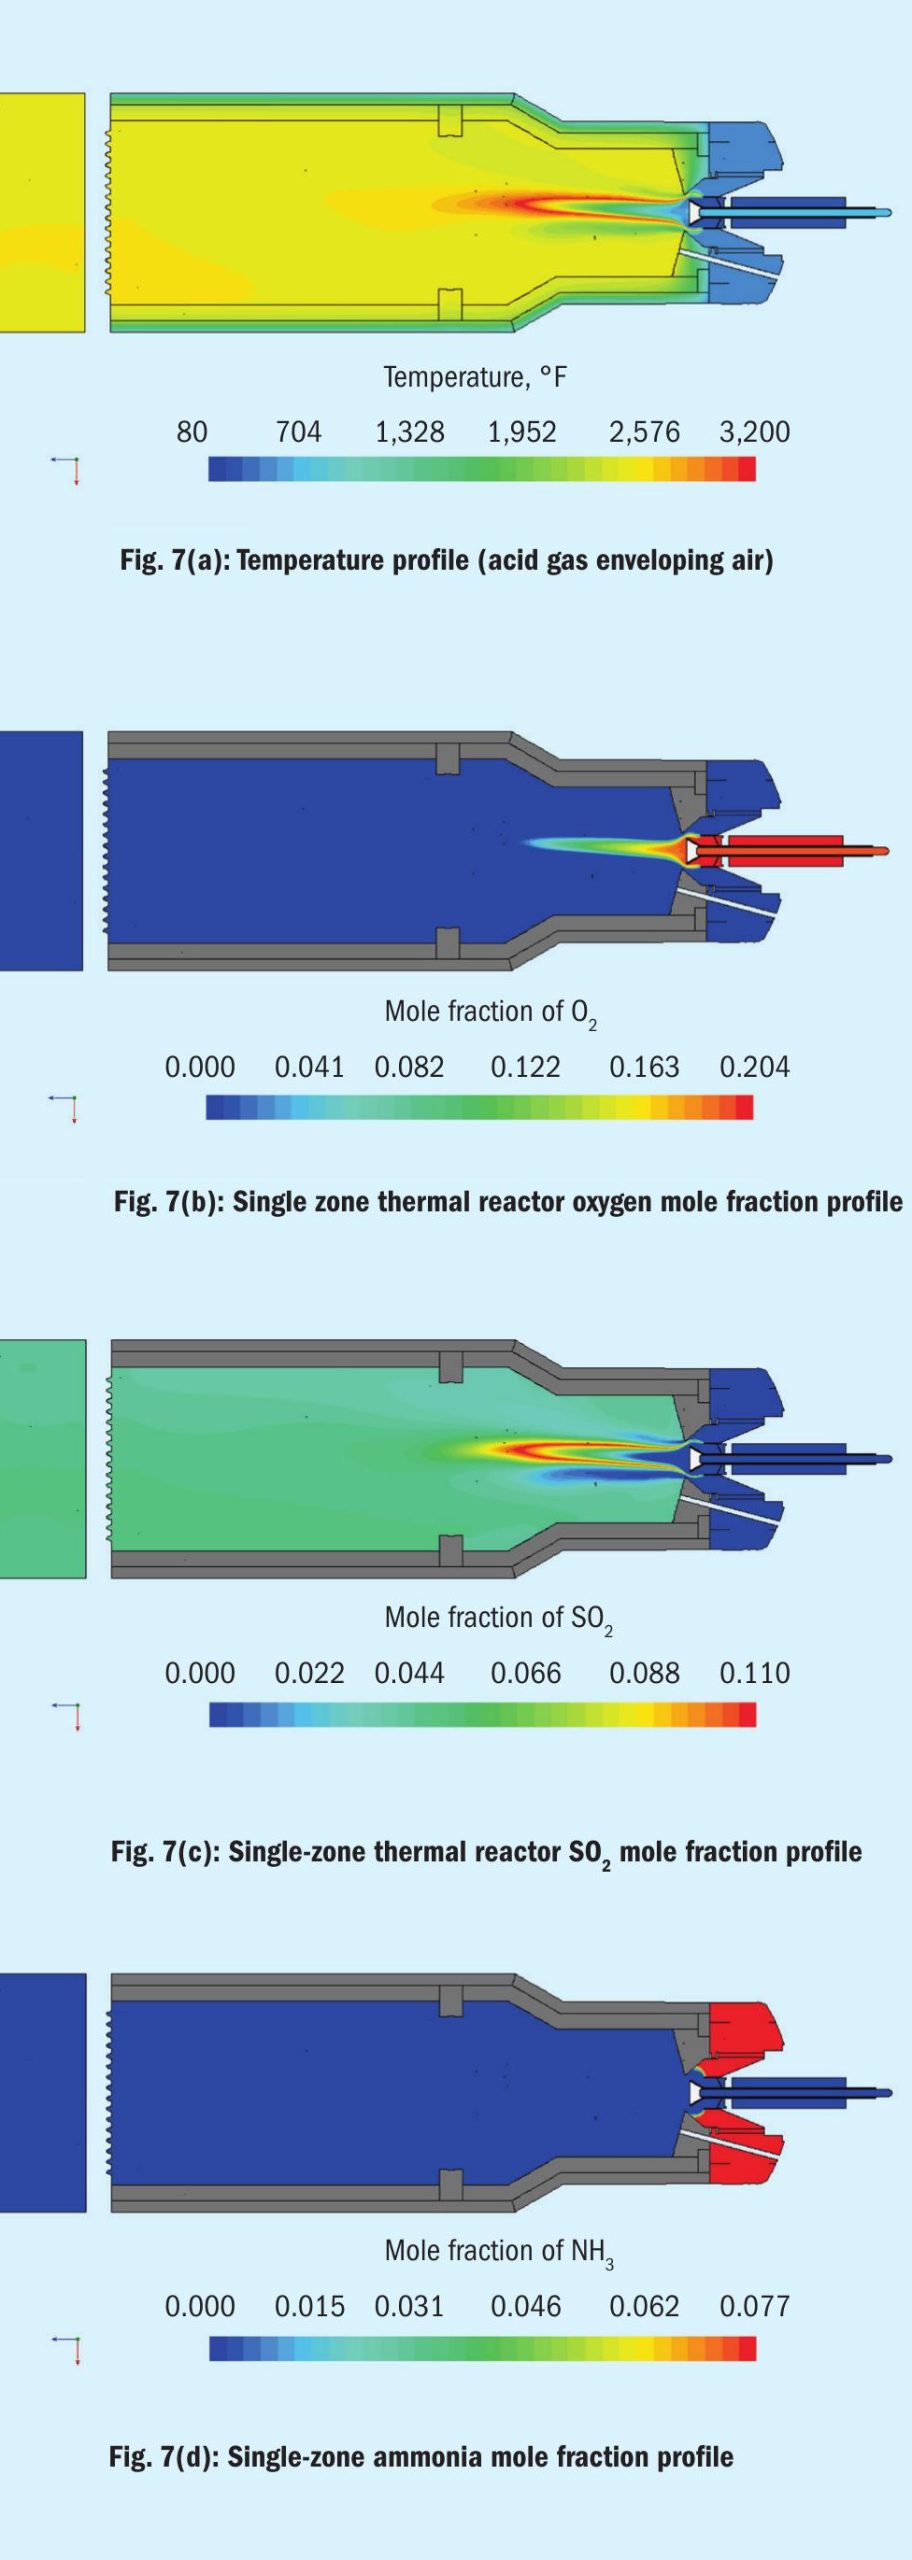
Now let’s turn our attention to high intensity mixing burners with thermal reactors. High intensity is defined by incorporating swirl vanes internal to the air and acid gas streams prior to the burner tip. We will again see two types, air enveloping acid gases and acid gases enveloping air.
The design in Fig. 7a is a one zone furnace with choke ring. Acid gas enveloping air produces the central cone-shaped combustion zone seen in the first low intensity burner model. A series of model profiles similar to that analysis follow.
Again, profiles for oxygen, SO2 , and ammonia mole fraction are used to illustrate the impact of the burner-thermal reactor design on ammonia destruction taking into consideration adherence to three “Ts” thinking. Figs 7b-d are for the acid gas enveloping air case.
The range of the scale didn’t allow intermediate concentration to show up as before.
Essentially the model shows the ammonia cannot stand up to the high temperature and high SO2 content in the narrow combustion zone denoted by the rapid consumption of oxygen. The time element of the three “Ts” does not seem to play a significant role in ammonia destruction.
This burner/thermal reactor performance is more of a function of the other two elements, temperature and turbulence. However, three “Ts” thinking, whether using temperature measured by thermocouple or pyrometer or adiabatic flame temperature as a guideline for operations, appears to be unimportant. The important temperature is in the combustion zone where the ammonia destruction action is. This temperature, as the CFD models show, can be several hundred degrees higher than measured or computed temperatures.
This leaves us with only one of the three “Ts”-turbulence in this case.
There is a great failing with the CFD models though. Measured ammonia never agrees with the equilibrium assumptions made for computing reaction chemistry. This is likely a failure of the assumptions used to build the mixing part of the model.
Fault for not achieving sufficient destruction is typically attributed to not having all three “Ts” in place. Without CFD modelling, decisions that may cause severe performance related problems or damage to the burner-thermal reactor may be enacted.
Concluding remarks
We now come back to the original question, “How meaningful are rules of thumb for claus unit ammonia destruction?”. We see with the CFD modelling that the real question we should have asked is: Were our assumptions leading to the three “Ts” valid?
Laboratory work and actual plant operations, confirmed by CFD modelling, say the assumptions were incorrect. Both laboratory and plant CFD models appear to demonstrate the following:
Ammonia destruction has two components. The first is preheat of the ammonia containing gas by the hot gases recirculating in the thermal reactor. All the models show the hottest place in the thermal reactor is at the combustion boundary. Both allow the ammonia containing gases to quickly reach the desired temperature “T”.
The second part is SO2 reaction with ammonia. The CFD models confirm H2 S is the fastest consumer of oxygen. Once oxygen is consumed by the H2 S in the flame, only SO2 remains to attack the ammonia.
In the end, several different styles of burner-thermal reactor arrangements accomplish similar levels of performance because they foster the conditions of preheat and SO2 formation in the combustion zone setting up ideal conditions for ammonia destruction.
If ammonia is not being destroyed, there could be many things going on. CFD modelling can identify what is expected. It is difficult to model the myriad of plugging, destroyed burner parts, or other impediments to ammonia destruction that may occur.
As with many rules of thumb, the three “Ts” are an expression of experience driven common sense. Sometimes there is a tendency to make common sense scientifically absolute. The three “Ts” are meaningful, but as the ASRL laboratory work and the CFD models show, they are not scientifically absolute.
Acknowledgement
This article is an abridged form of the paper “How Meaningful Are Rules of Thumb for Claus Ammonia Destruction?”, presented by Al Keller, on behalf of the Amine Best Practices Group at Brimstone “Virtual” Vail Symposium September 15-17, 2020.
Reference