Fertilizer International 508 May-Jun 2022
31 May 2022
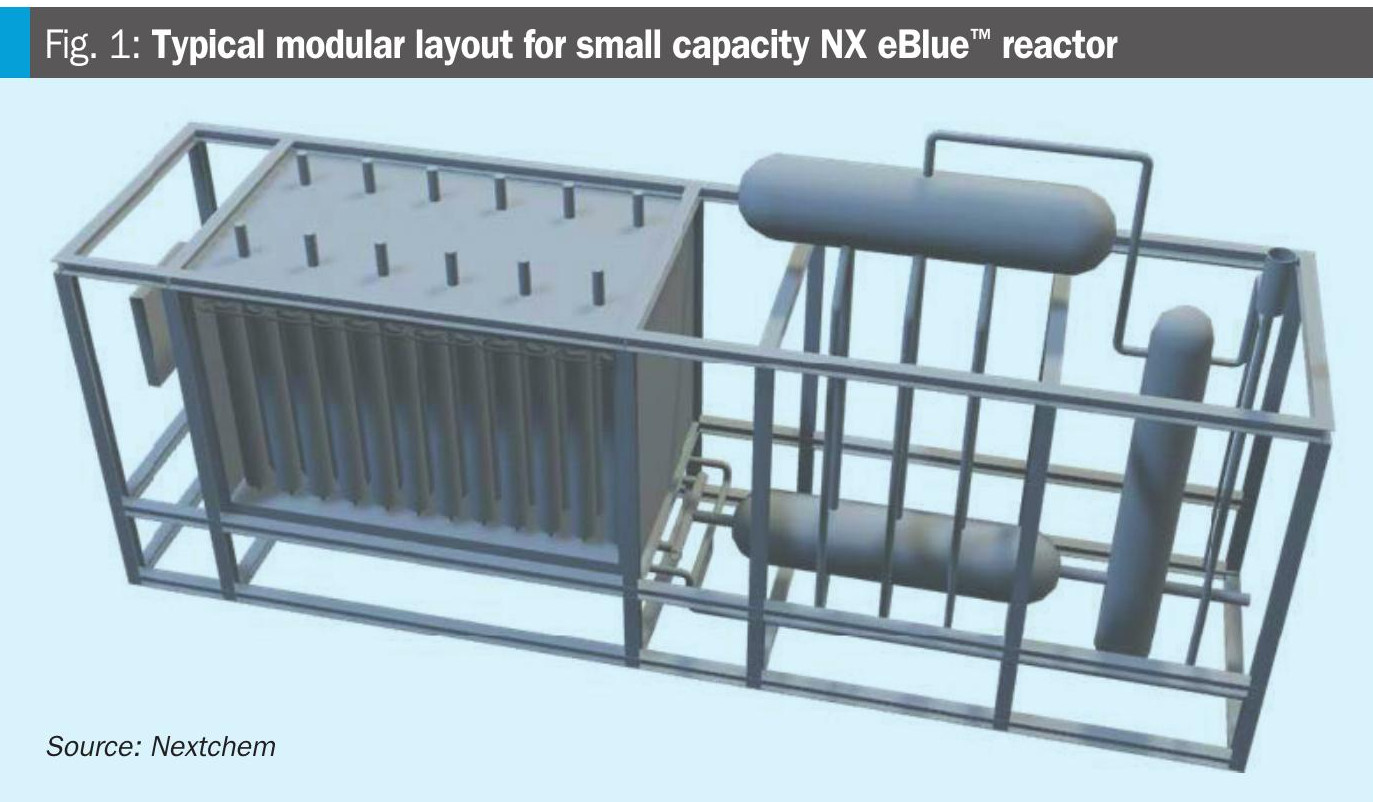
Pathways to green ammonia
SUSTAINABLE PRODUCTION TECHNOLOGY
Pathways to green ammonia
The recently-published IEA Ammonia Technology Roadmap sets out a future pathway for decarbonising the nitrogen industry. New technology options for low-carbon ammonia production are emerging and project activity is on the rise.

The Ammonia Technology Roadmap – a collaboration between the International Energy Agency (IEA), the European Bank for Reconstruction and Development (EBRD) and the International Fertilizer Association (IFA) – was published last October in advance of November’s COP26 climate conference in Glasgow1 . Recently described by IFA as its number one priority (Fertilizer International 505, p36), the roadmap sets out a plan to decarbonise ammonia production globally by 2050.
In this article, we look at future of ammonia production and the technology options needed to dramatically cut the industry’s carbon emissions in under three decades. This will require massive and sustained investment and radical and rapid change.
“The world will need more ammonia but cannot afford the emissions that come with its production,” said Timur Gül, the Head of the IEA’s Energy Technology Policy Division, who designed and directed the roadmap. “The IEA is proud to have collaborated with the International Fertilizer Association to produce our roadmap for the ammonia industry, which sits at the nexus between the world’s energy and agricultural systems.”
An essential and widely-traded commodity
Ammonia is one of the world’s most widely produced commodity chemicals and an essential feedstock in fertilizer manufacture. Currently, virtually all ammonia manufactured on an industrial scale is synthesised via the energy-intensive Haber-Bosch process.
Some 185 million tonnes of ammonia were produced globally in 2020. China is the world’s largest ammonia producer, accounting for 30 percent of global production and 45 percent of associated CO2 emissions. The US, EU, India, Russia and the Middle East are the other major producing countries and regions, each accounting for a further 8-10 percent of production.
Three possible futures
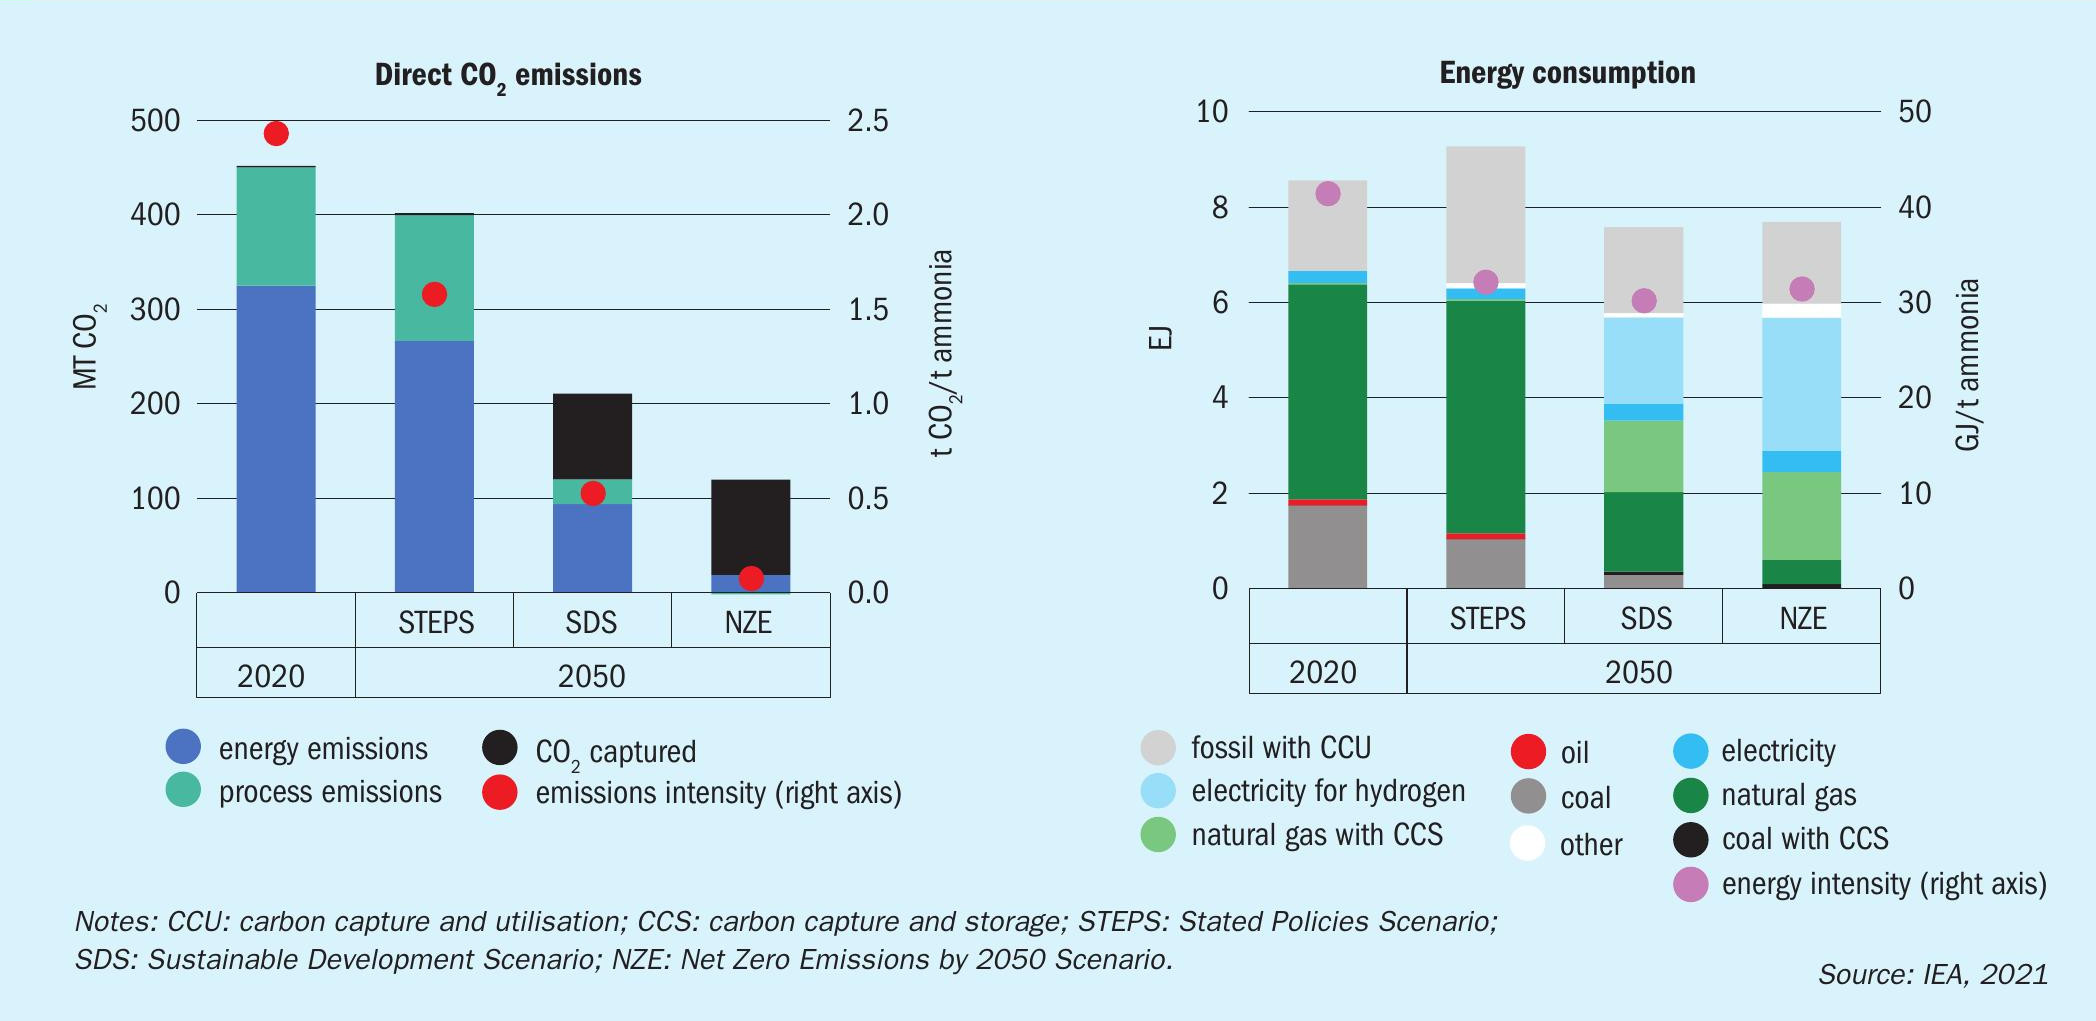
The IEA’s Ammonia Technology Roadmap sets out three future scenarios for ammonia production – each with different sets of actions and outcomes by 2050 (see Figure 1)
- Stated Policies Scenario (STEPS). The industry follows current trends and, while making incremental improvements, falls well short of a sustainable trajectory.
- Sustainable Development Scenario (SDS). The sector adopts the technologies and policies required to put it on a pathway to meet Paris Agreement goals.
- Net Zero Emissions by 2050 Scenario (NZE). A trajectory for the ammonia industry that reaches net zero global emissions by 2050.
While the STEPS scenario is a modest improvement on businessas-usual that only delivers marginal emissions cuts, both the SDS and NZE scenarios deliver desirable outcomes, according to the IEA, by achieving 70-95 percent emissions reductions. These two scenarios would, however, require the ammonia industry to either meet or go beyond Paris Agreement goals.
Stated Policies Scenario (STEPS)
This assumes that progress over the next 30 years is driven by currently stated government policies. This projection is based on current trends in consumption and production and commitments made at the COP-26 meeting in Glasgow. In this scenario:
- Ammonia production would increase by 37 percent by 2050, driven primarily by economic needs and population growth
- While emissions from production fall by about 10 percent
- Cumulative direct emissions from ammonia production between now and 2100 would amount to around 28 gigatonnes (Gt)
- This amount is equivalent to six percent of the emissions budget needed to limit global warming to 1.5°C.
The report assumes that actions under STEPS – because they do not improve enough on business-as-usual – are inadequate and would result in unsustainable outcomes.
Sustainable Development Scenario (SDS)
This assumes that governments and industry actions meet the goals of the Paris Agreement and limit the global temperature rise to well below 2°C. The two key elements in this scenario are:
Cutting direct CO2 emissions from ammonia production by more than 70 percent, relative to today
Action on nitrogen use efficiency (NUE) to limit the growth in ammonia production and consumption to 23 percent by 2050. Four main actions would make the following individual contributions to this 70 percent reduction in emissions:
- 45 percent achieved by deploying low-carbon technologies – including electrolytic hydrogen generation (30% of emissions reduction) and carbon capture and storage (CCS, 15%)
- Energy efficiency from the adoption of best available techniques (BATs) and operational improvements contributes 25 percent
- Fuel switching – from coal-based production to less energy intensive gas-based production – is responsible for 10 percent of the reduction
This ambitious scenario requires:
- $14 billion in annual capital investment for ammonia production to 2050
- The installation of more than 110 gigawatts (GW) of electrolyser capacity
- 90 million t/a of CCS CO2 storage capacity.
Net Zero Emissions by 2050 Scenario (NZE)
This sets out a trajectory for a fall in ammonia industry emissions of 95 percent by 2050. The additional emission reductions in this scenario – compared to the ambitious SDS trajectory – are achieved by even more rapid deployment of electrolysis and CCS technologies. The main difference between NZE and the SDS scenarios is therefore one of degree. Indeed, the NZE Scenario requires only slightly higher annual investment: $15 billion per year to 2050.
Ammonia is also a widely traded commodity, with global exports equating to about 10 percent of total production.
Key fertilizer feedstock
Fertilizers are by far the largest end market, accounting for around 70 percent of total ammonia demand. The remaining 30 percent is destined for a wide range of industrial markets, principally plastics, explosives and synthetic fibres.
Urea is the most common derivative, being responsible for around 55 percent of ammonia demand. Urea is mainly used:
- As a direct-application fertilizer (75%)
- In urea ammonium nitrate (UAN) production (5%)
- For industrial applications (20%).
Nitric acid is the other key derivative and accounts for much of the remaining 45 percent of ammonia demand. Subsequently, around 80 percent of nitric acid then goes on to be used to manufacture ammonium nitrate (AN) – with around two-thirds of the AN obtained ultimately ending up as fertilizer.
Energy intensive
Producing ammonia requires a lot of energy. On average, around 2.4 tonnes of carbon dioxide are emitted per tonne of ammonia produced, although this varies according to the hydrocarbon feedstock used. To put this in context, ammonia’s per tonne emissions intensity is twice as high as steel, for example, and four times higher than cement.
Direct emissions from ammonia production currently total 450 million t/a of carbon dioxide equivalent (CO2 e) globally. This is comparable to the total energy emissions of South Africa. Indirect CO2 emissions contribute a further 170 million t/a CO2 e per year. These stem from two main sources – electricity consumption and urea hydrolysis in soils – together with N2 O emissions from downstream nitric acid production. Overall, ammonia is responsible for 1.75 percent of global CO2 emissions, taking into account its direct and indirect contribution.
Cutting production emissions
The IEA’s roadmap identifies several emerging low-carbon technologies for ammonia synthesis – what it calls ‘nearzero-emission production’ routes. The most promising include:
- Water electrolysis
- Conventional production coupled to downstream carbon capture and storage (CCS)
- Methane pyrolysis
- Biomass gasification
“These emerging routes are typically 10-100 percent more expensive per tonne of ammonia produced than conventional routes, depending on energy prices and other regionally varying factors,” the IEA comments1 . “Existing and announced projects totalling nearly eight million tonnes of near-zero-emission ammonia production capacity are scheduled to come online by 2030, equivalent to three percent of total capacity in 2020.”
The roadmap sets out two trajectories (see box) capable of delivering “a range of desirable futures for the ammonia industry”:
- In the Sustainable Development Scenario (SDS), direct CO2 emissions fall by over 70 percent by 2050 relative to today
- While the Net Zero Emissions by 2050 Scenario (NZE) achieves a 95 percent cut in emissions by 2050.
Essentially, the SDS scenario would mean the ammonia industry would operate within the goals of the Paris Agreement, and therefore help limit the global temperature rise to below 2°C. The more exacting NZE scenario, meanwhile, would essentially transform ammonia production into a net zero industry (see box).
Under both these future scenarios, the IEA expects the deployment of low-carbon technologies to do most of the heavy lifting on emissions reductions out to 2050. In the SDS, scenario, for example, ammonia production by electrolysis would account for around one-fifth of global production globally by 2050 (versus less than 0.01% today), this share rising to above 40 percent in Europe, India and China. In the NZE scenario, meanwhile, the global production share for the electrolysis pathway doubles to more than 40 percent.
Carbon capture and storage (CCS) also looks set to play an increasing role, capturing 91 million tonnes and 101 million tonnes of ammonia industry CO2 emissions annually by 2050 in the SDS and NZE scenarios, respectively.
These two low-carbon technologies would need to be “deployed at a rapid clip” according to the IEA’s roadmap1 . This is, if anything, an understatement. Under the SDS scenario, for example, more than 110 GW of electrolyser capacity and 90 million t/a of CO2 transport and storage infrastructure would be needed by 2050. That equates to the installation of ten 30 MW electrolysers (the largest capacity currently in operation) per month on average, together with the completion of one large-scale CCS project (1 million t/a CO2 capacity) every four months between now and 2050. Even more rapid deployment of these technologies would be necessary under the IEA’s most ambitious NZE scenario.
Rapidly deploying these carbon cutting technologies at scale will not be cheap either – requiring of $14-15 billion to be invested annually for the next 30 years.
Another challenge will be massive industry investment already locked up in existing long-life assets. Ammonia production plants can remain in operation for up to 50 years. Globally, the current average age of installed ammonia capacity is around 25 years. This figure does, however, vary widely from region to region. In Europe, for example, the average age of plant capacity is close to 40 years – that compares to just 12 years in China, where most new capacity has been built in the past 20 years.
The IEA accepts there will be a need to tackle ‘locked-in’ emissions from existing ammonia production infrastructure by:
- Retiring or underutilising existing assets early, if these become uneconomic due to changing market conditions, or because of new regulations that force early closure or partial operation
- Refurbishments and retrofits which enhance process integration, energy efficiency and introduce emission reduction technologies by partly replacing natural gas with electrolytic hydrogen or implementing CCS.
- Introducing fuel switching and fuel blending to allow existing plants to run on less carbon-intensive fuels.
Changes In future demand
Globally, per capita nitrogen demand for fertilizers was estimated at 14 kg in 2018. Regionally, this varies from:
- 35 kg in the US
- 22 kg in Brazil
- 20 kg in China
- 13 kg in India.
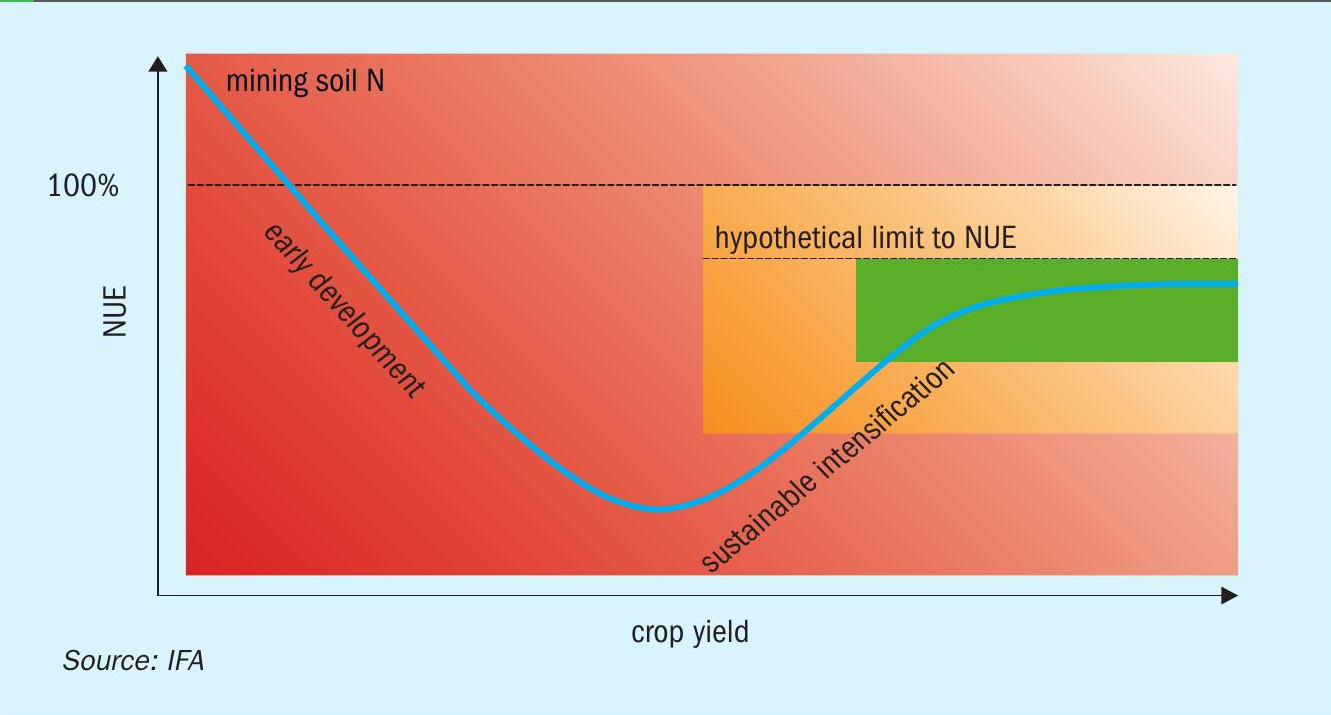
In general, nitrogen demand per capita declines as a country’s agricultural market matures and nutrient use efficiency (NUE) improves (see Figure 2).
Global nitrogen demand totalled 152 million tonnes in 2020. This is forecast to grow by another 40 percent by 2050 under the IEA’s business-as-usual (STEPS) scenario, reaching 208 million tonnes. This is equivalent to an average annual growth rate of about one percent – albeit significantly below the 1.7 percent p.a. average for 2010-2020.
This business-as-usual assumption is underpinned by a slowdown in industrial ammonia demand from around 4 percent p.a. currently to 1.3 percent annually. Fertilizer sector demand for ammonia, meanwhile, is expected to continue to grow at its current rate of around 0.9 percent per year.
In contrast, in the IEA’s SDS scenario, total nitrogen demand growth slows to 0.7 percent annually, leading to a less marked 25 percent increase in total nitrogen demand by 2050. This is linked to the adoption of measures to improve NUE. It also assumes that current usage of urea-based fertilizers declines by 28 percent by 2050, due to product substitution by ammonium nitrate (AN) and calcium ammonium nitrate (CAN).
Urea’s current market dominance, versus rival nitrogen fertilizers, is largely explained by its higher nitrogen content (46%) and greater convenience when it comes to storage, transport and application. Yet urea also contains CO2 – locked in during production – that is later released during hydrolysis after it’s applied to soils.
This behaviour is likely to be an increasing disadvantage as energy and agricultural systems become more sustainable in future, given that the emissions released by urea during agricultural usage – around 130 million t/a CO2e in 2020 – are equivalent to about 30 percent of total ammonia production emissions. This is likely to prompt a partial switchover to AN and CAN, the IEA suggests, as these do not release CO2 during their use.
Extra to current agricultural and industry usage, the IEA is forecasting rapid growth in demand for ammonia as an energy carrier, primarily in the maritime fuel and power sectors. Total ammonia demand is forecast to rise to 355 million tonnes annually in 2050, about twice the 185 million tonnes produced in 2020. This total includes 125 million t/a of demand for ammonia as energy carrier by 2050, in addition to 230 million t/a of conventional demand.
Costs hold the key
As already indicated, there are two main emerging routes to a low carbon ammonia future:
The deployment of carbon capture and storage (CCS) as a bolt-on downstream technology – the so-called ‘blue’ ammonia production route.
A shift to water electrolysis-based production – the so-called ‘green’ ammonia production route.
Although slightly elevated, the costs of blue ammonia production tend to be broadly similar to conventional, unabated ‘grey’ ammonia production – because both are already located in regions with the lowest capex and energy costs. The slightly higher cost for the CCS production route – which adds 10-25% to the costs of natural gas-based ammonia production – is attributable to:
- Higher energy consumption
- CO2 transport and storage costs
- Extra capex and opex costs of the carbon capture equipment.
For blue ammonia, the good news is that more than enough CCS capacity should be available globally to satisfy the needs of the ammonia industry, according to the IEA1 :
“Substantial [CO2 storage] capacity is expected to exist in Russia, North America, Africa and Australia, [with] global capacity far exceeding storage needs for the full energy system over the period 2020-2050. Therefore, regional availability of CO2 storage capacity would not be a limiting factor for the deployment of this technology in the ammonia industry.”
The costs for green ammonia production, in contrast, are mainly determined by the cost of the electricity used, with the electrolyser unit itself responsible for 90 percent of electricity consumption. The use of dedicated variable renewable energy (VRE) source, versus grid-sourced renewable electricity, also affects costs.
Solar and wind installations typically operate at capacity factors of between 15-50 percent. As a result, for those projects with a dedicated VRE source, electrolyser capacity generally needs to be oversized to compensate to allow for the intermittency. Hydrogen or electricity storage can also be used to ensure that a stable supply of hydrogen is supplied to the ammonia synthesis unit.
“Projects under development to produce electrolytic ammonia include those using a grid connection and others using dedicated capacity,” the IEA reports1 . “For example, Yara’s project in Norway and CF Industries’ project in the United States will be grid-connected, while Yara’s projects in the Netherlands and Australia and Enaex’s project in Chile will be powered by dedicated solar or wind power.”
The IEA roadmap identifies a number of promising low cost VRE sites globally1 : “With respect to the levelised cost of electricity, in 2020 locations in Chile, Spain, the United States and Saudi Arabia have lower-cost solar resources; those in China and Morocco have a cheaper wind resource, and the locations in India, South Africa and Australia are more balanced. In 2030, however, solar PV becomes cheaper than wind power in all locations except the site in China.”
For methane pyrolysis and biomass gasification – the other emerging production routes for low-carbon ammonia production – there are cost uncertainties because no commercial-scale plants are operative yet. The cost premium for biomass gasification is, however, likely be very large – owing to its very high energy intensity (37 GJ/t including feedstock) and the relatively high cost of bioenergy in general. Costs for methane pyrolysis can be offset by the revenue generated from sale of the carbon black co-product. This can raise around $360/t, although the market for carbon black is limited and unlikely to sustain product generated by a large numbers of pyrolysis-based ammonia plants.
How to get there?
Governments, by creating supportive policies, will need to play a central role – if the global ammonia industry is to transition to a low-carbon future and achieve emissions cuts on the scale set out in the roadmap. Legislators will need to introduce mandatory emission reduction policies and policy mechanisms that mobilise investment. According to the IEA, targeted policy is also required to:
- Address existing emissions-intensive production assets
- Create markets for low-carbon products
- Accelerate R&D
- Incentivise high nutrient use efficiency for fertilizer products derived from ammonia.
Governments are also uniquely responsible for the putting in place enabling conditions for the energy transition. This includes ensuring a level playing field exists for green and blue ammonia in global markets, providing the necessary infrastructure for hydrogen and CCS, and making sure that robust data on emissions performance are available.
While governments are the enablers, other key players will have to respond rapidly to their policy cues. In particular:
Ammonia producers will need to establish low-carbon transition plans with emissions reduction targets, accelerate their R&D investment, and develop the infrastructure needed to support green and blue ammonia production
Farmers and agronomists will have to implement best management practices (BMPs) that ensure more efficient fertilizer use
Financial institutions and investors will need to devise instruments that efficiently target finance at emissions reduction
The help of researchers and non-governmental organisations will also be necessary – to develop product labelling schemes, scale-up and demonstrate emerging technologies and galvanise support for these.
The proposed radical transformation of the ammonia industry will need to be pushed through at a dizzyingly fast pace. Near-term action in the current decade – from now to 2030 – will be critical. The IEA says time if of the essence and expects some 10 percent of cumulative emissions reductions needed by 2050 to take place in the 2020s.
Green ammonia – an enabler of decarbonisation
Future cost reductions for green ammonia are predicated on factors such as lower renewable prices, upscaling of the technology, access to financing and willingness to pay a ‘green premium’. At the same time, production costs for conventional (‘grey’) ammonia look set to escalate in future due to increasingly stringent environmental regulations, carbon pricing and cost inflation.
“The commercial feasibility of green ammonia projects will vary greatly depending on the time required to bring down opex and capex costs, the individual plant configurations, the business models and the locations of these projects. Developers need to consider delivered cost too, and prices in different geographical and application markets, to fully understand their projects,” CRU’s Willis Thomas commented recently (Fertilizer International 505, p36).
Green ammonia projects will also require strong business cases to win financing, according to Thomas: “The growing numbers of green ammonia projects globally will mean developers face increasing competition for financing. Thus, they must build and stress test their project business case both early and often.”
By 2050, around 70 million tonnes of existing fossil fuel-based ammonia capacity will be shut down or converted to renewable inputs, according to Ammonia Energy Association estimates, while 500 million tonnes of additional green ammonia capacity is set to be developed using renewable inputs (electricity, biomass). The established fertilizer market supplemented by substantial emerging markets for maritime fuel, hydrogen carriers and fuels for electric power generation are all expected to ratchet up demand for ‘clean’ ammonia.
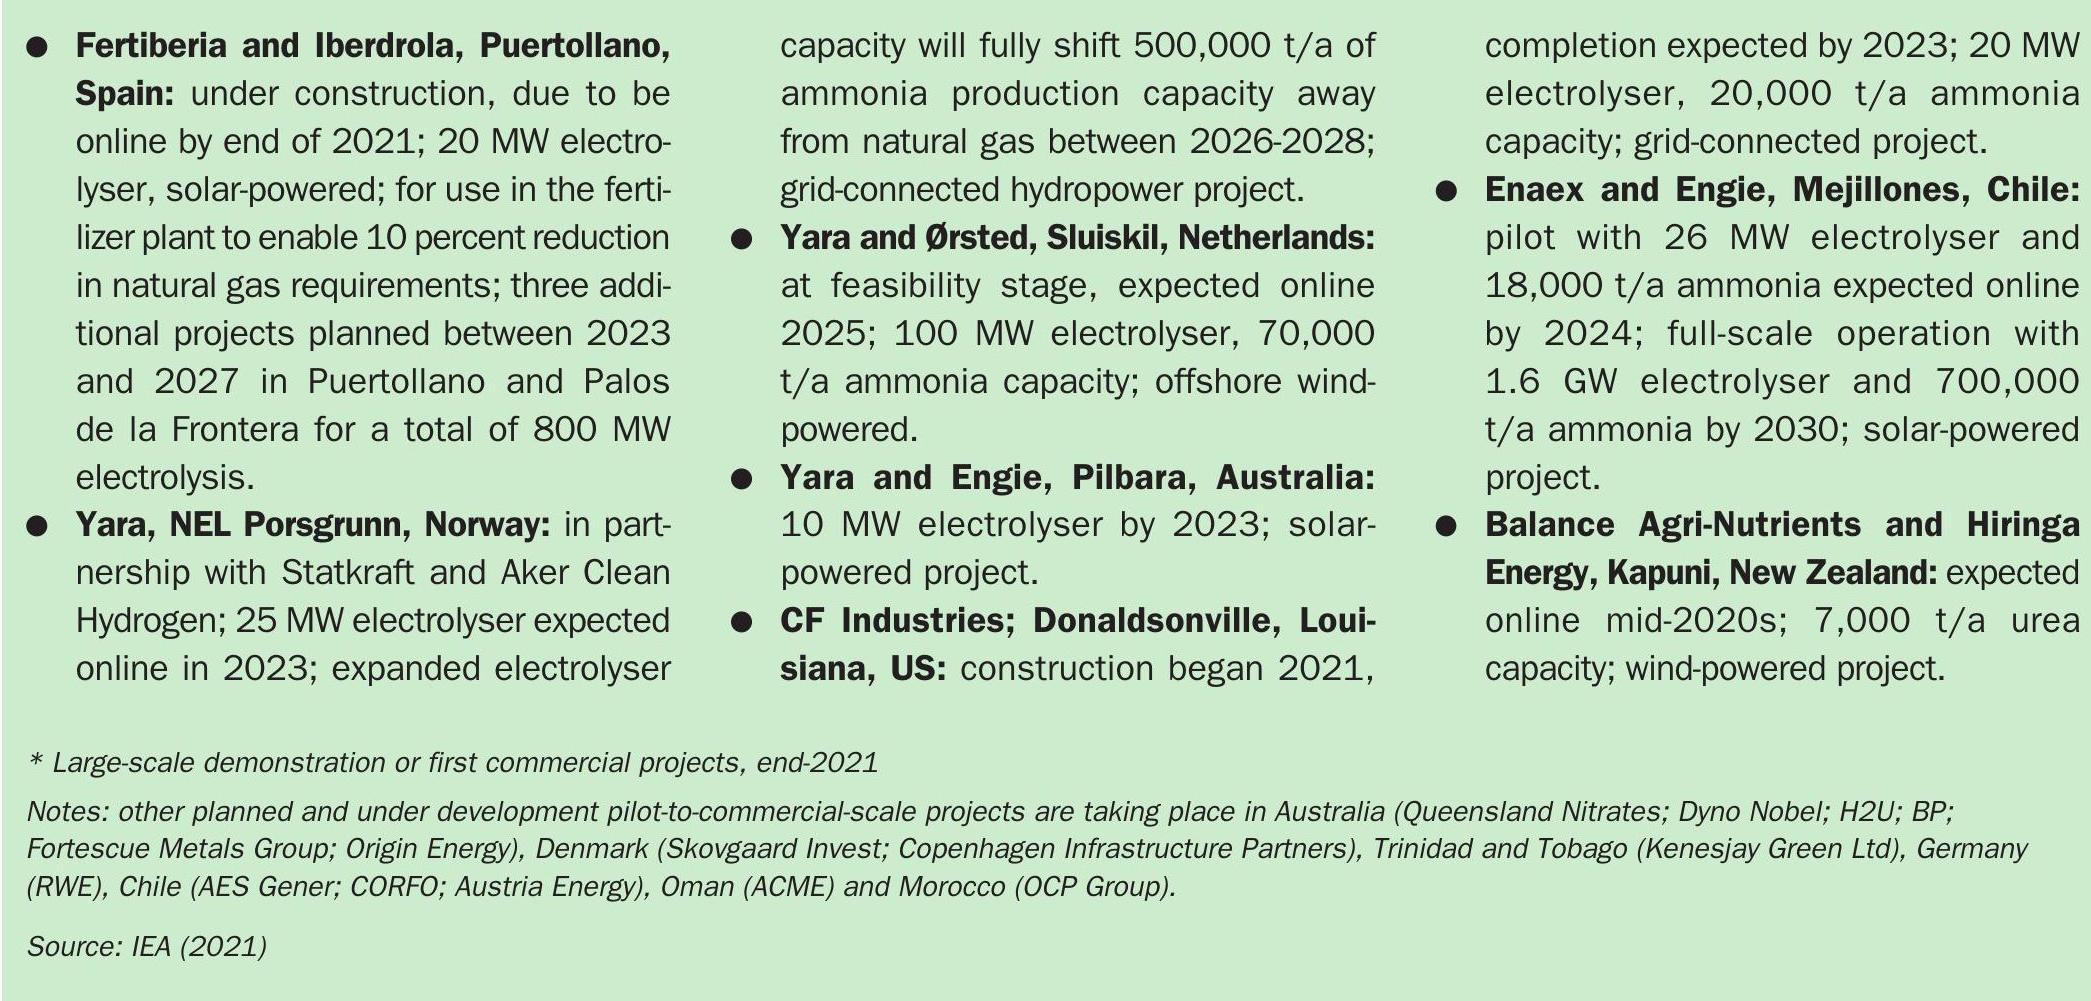
Current fertilizer industry green ammonia projects are shown in Table 1. Yet the scale of these is relatively minor compared to newly-announced non-fertilizer projects for green ammonia. These include the following mega projects (maximum ammonia and electrolyser capacity shown):
- Asian RE Hub, Australia: 9.9 million tonnes, 16 GW
- Svevind, Kazakhstan: 15 million tonnes, 45 GW
- Aman, Mauritania: <20 million tonnes, 30 GW
- Al Wusta, Oman: <10 million tonnes, 15 GW
- Western Green Energy Hub, Australia: 20 million tonnes, 50 GW
- Grand Inga Dam, DRC: >20 million tonnes, 40 GW hydroelectric.
Projects on this scale are going to be needed if shipping and other industries are going to be fully decarbonised over the next two to three decades, according to the Ammonia Energy Association. Even five percent decarbonisation of the shipping industry by 2030 – via the adoption of zero-carbon maritime fuels – would require 60 GW of electrolyser capacity making 30 million tonnes of green ammonia. Furthermore, the 93 percent decarbonisation of shipping by 2046 would necessitate one terawatt of capacity generating 300 million tonnes (Fertilizer International 505, p36).
“In various stages of development, we’ve got about 100 million tonnes of green ammonia underway from roughly 200 gigawatts of renewable electricity, with some more committed than others. When you’re scaling up to this size, it’s a lot easier to see how the economies of scale are going to come in, and how financing is going to enable a molecule like ammonia to actually support decarbonisation in industries like the maritime fuel sector,” the Ammonia Energy Association’s Trevor Brown said recently (Fertilizer International 505, p36).
References