Nitrogen+Syngas 379 Sept-Oct 2022
30 September 2022
Process optimisation and emissions abatement in nitric acid production
NITRIC ACID PRODUCTION
Process optimisation and emissions abatement in nitric acid production
Optimisation of the nitric acid process depends on good process visualisation tailored to the specific process parameters of the plant, improvements in combustion efficiency, reduction of N2O emissions and the optimal use of platinum group metals.
UMICORE AND THYSSENKRUPP INDUSTRIAL SOLUTIONS
GreenSalpeter project: For a better understanding of Pt-catalysed ammonia combustion
With a production of more than 60 million tonnes per year, ammonia oxidation via the Ostwald process is the main route to producing nitric acid production and has a large economic and environmental impact. Due to the energy intense Haber Bosch process, which is applied to produce the feedstock ammonia (NH3 ), there is a great potential to increase overall sustainability by reducing the formation of byproducts (N2 and N2O) and thus increasing the yield of nitric acid per tonne of ammonia.
Despite the fact that the Ostwald process has been in use for over a century, there is still a knowledge gap concerning the complex interaction of chemical kinetics and process parameters (p, T, flow field, catalyst geometry). The harsh reaction conditions, very fast kinetics, strong influence of mass and heat transport limitations and especially the strong coupling of all phenomena complicate studies of the system under industrial conditions.
To investigate this complex process and to get a more detailed understanding of the interaction of different influencing factors governing the selectivity and efficiency of the process, catalyst provider Umicore, together with thyssenkrupp Industrial Solutions, the largest process licensor for nitric acid plants, and Umesoft, a data science company, are working together in a joint development project, the GreenSalpeter project, funded by the German Federal Ministry for Economic Affairs and Climate Action. The main development subjects are the improvement of the combustion efficiency, the reduction of N2O emissions and the usage of platinum group metals. Big progress has been achieved in the field of computational fluid modelling coupled with detailed kinetics of the ammonia oxidation reaction1-3 .
Experimental setup
In order to study the Ostwald process on a laboratory scale, key parameters of the industrial process have to be met. This includes short residence times and thus high volume flows up to 5,000 lN h-1 , pressures up to 5 atm, preheating temperatures up to 450°C, reaction temperatures over 850°C and ammonia volume fractions in air up to 13%. The laboratory setup not only meets the criteria, but also uses separate preheating of the reaction mixtures as well as chemically inert catalyst fixation and gas sampling to prevent undesired side reactions. The product stream can be fully analysed using an integrated quadrupole mass spectrometer. Various industrial platinum group metal gauzes varying in compositions, mesh geometries and stacking can be studied. Process conditions can also be varied2 .
CFD modelling
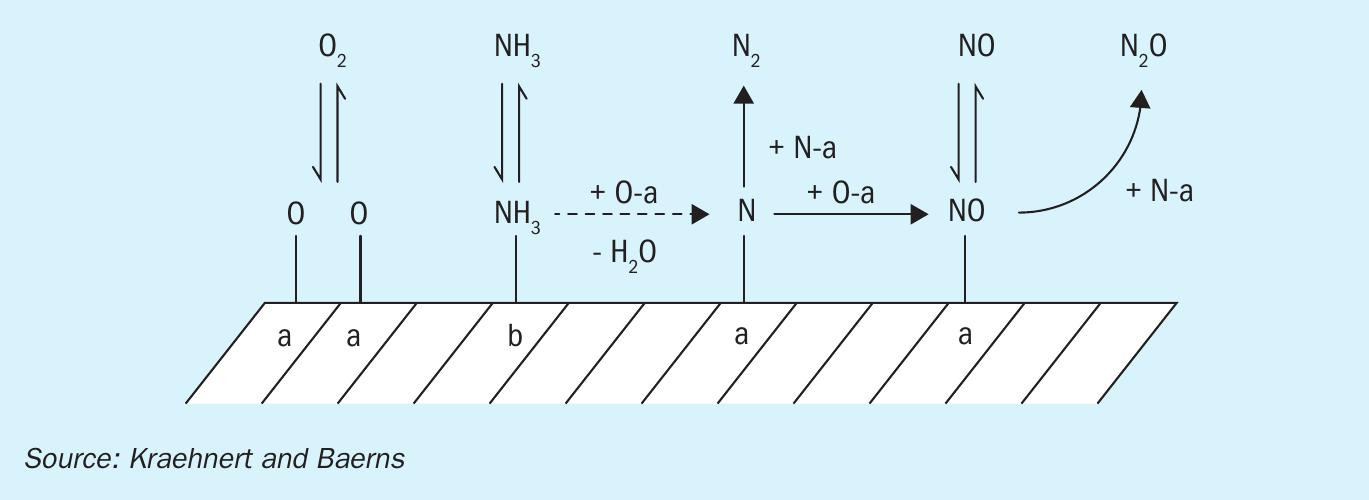
The kinetic model (model C) previously published by Kraehnert and Baerns was chosen for the implementation in a CFD simulation, because it provided the best correlation between experimental and computed rates of product formation in the Kraehnert work4. Fig. 1 shows the mechanistic scheme and parameter of the model for ammonia oxidation used. The reaction mechanism contains ten reactions, six gas species, and six surface species. The adsorption reactions for oxygen, ammonia, and nitrogen oxide are reversible. The adsorption of the formed by-products N2 and N2 O is not included. Possible gas phase reactions are neglected in this work. There is no agreement in the literature about the role of gas phase reactions during ammonia combustion. Solid lines show elementary reactions and the dashed line shows a lumped reaction4 .
The Kraehnert-mechanism is a further advancement based on the kinetic model on Pt/Al2 O3 near atmospheric pressure. In the mechanism, the polycrystalline Pt surface of the catalytic gauze is assumed to be similar to Pt (1 1 1) surface. The energetic data for adsorption of species on a Pt surface were provided by DFT calculations. Kinetics for oxygen desorption is assumed to be coverage independent. The stepwise activation of ammonia (hydrogen stripping by oxygen atoms) is simplified to one stoichiometric reaction with the assumption that the first step (NH3 + O) is rate determining. The production of water is also included in that step. The mechanism includes two different adsorption sites on Pt surface: sites “a” for O, N, and NO and sites “b” for NH3. Hence, a competition for adsorption sites between oxygen and nitric oxide can be concluded. This fact is also supported by spectroscopic evidence.
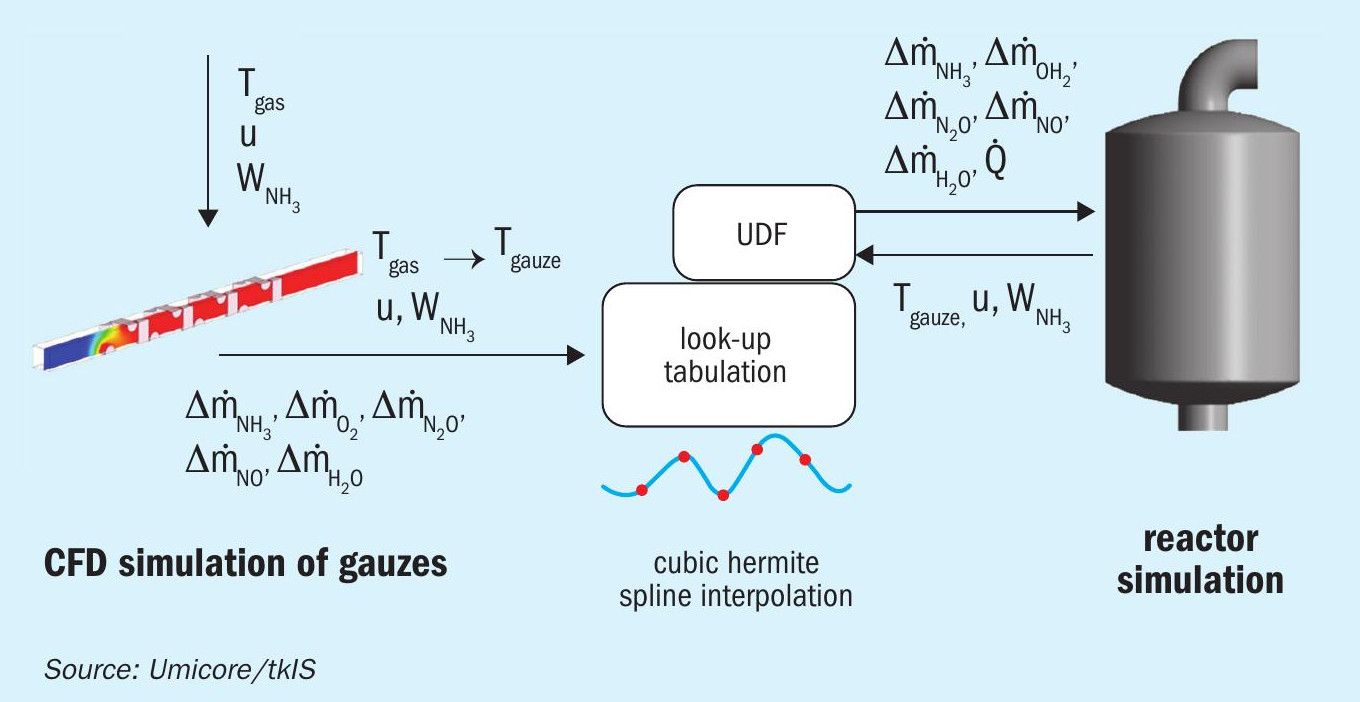
The mechanistic surface kinetic model has been implemented in CFD simulations using the rate mapping approach previously published by Votsmeier5 . The purpose of the rate mapping procedure is to provide source terms for the gas species by interpolation of a spline function between a certain number of points in a rectangular grid. The spline function represents a functional relationship between the input parameters and the gas phase source terms. The grid points are computed in a pre-processing step and saved in so-called “look-up tables”. During the simulation, the software interacts with look-up tables to get the source terms for the gas species by interpolation of the spline function between the grid points. This approach decouples the calculation of the fluid flow and the numerical treatment of the surface kinetic and provides a faster convergence of the solution in the CFD model requiring less computational time1 .
A similar approach allows for investigation of the interplay of reaction conditions, reactor design and the micro kinetics at the platinum gauze surface. A scheme of the calculation procedure is shown in Fig. 2.
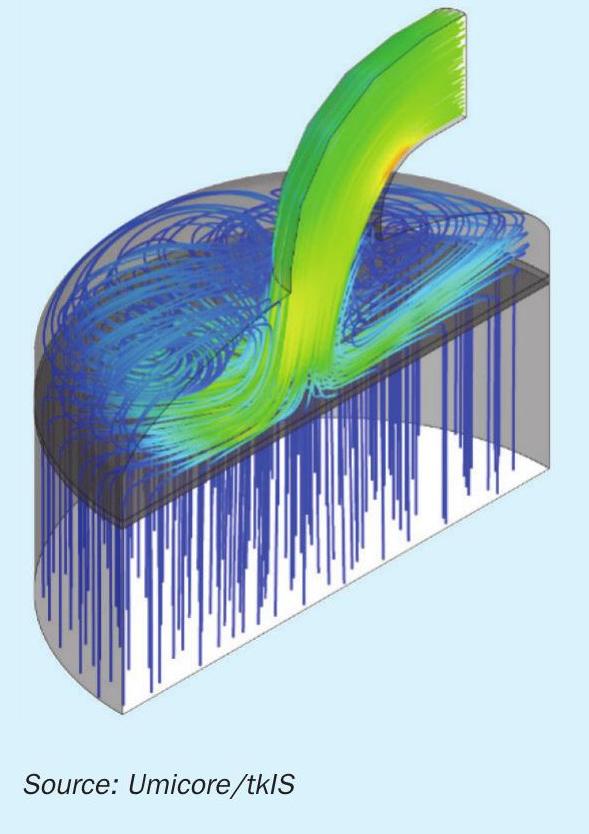
First, CFD simulations including the kinetic mechanism described above of a small excerpt of a Pt gauze are performed at different process and flow conditions. The results of these calculations concerning the conversion of mass by the ammonia oxidation reactions are stored in look-up tables. Cubic Hermite splines are used. An orthogonalisation procedure ensures a rectangular grid in the dimension of gauze temperatures. Process and flow conditions of the ammonia oxidation reactor are simulated by CFD as shown in Fig. 3.
User defined functions (UDF) trigger a mapping process, which maps the mass conversions from the look-up tables to the suitable process and flow conditions from the CFD simulation. The result is a locally resolved map of the resulting mass flows of NO, NO2 and N2 O as well as reaction temperatures at the catalyst surface. These results help to optimise the reactor design with regard to a uniform temperature distribution and maximised NO selectivity.
Gas phase reactions
Chemical processes in the gas phase during the ammonia oxidation have been studied. These processes involve the species included in the Ostwald process, for instance the homogeneous oxidation of NH3 or the selective non catalytic reduction of nitrogen oxides (NOx) by NH3. One of the key features of the homogeneous schemes is its reliance on the characteristics of each process variable. Therefore, it is of interest to determine the role of such reactions in the gas phase of the ammonia oxidation process.
Due to the complexity of the chemical mechanisms of the processes in the gas phase, reduction and implementation through computational simulation tools is necessary. While catalytic reactions favour NO formation, the gas phase reactions promote N2 and N2O formation due to NO reduction. The simulations will allow the route to be established by which these sub-products are formed and help to reduce their negative impact on the process efficiency, and the environmental impact of the Oswald process6.
Results
Experiments
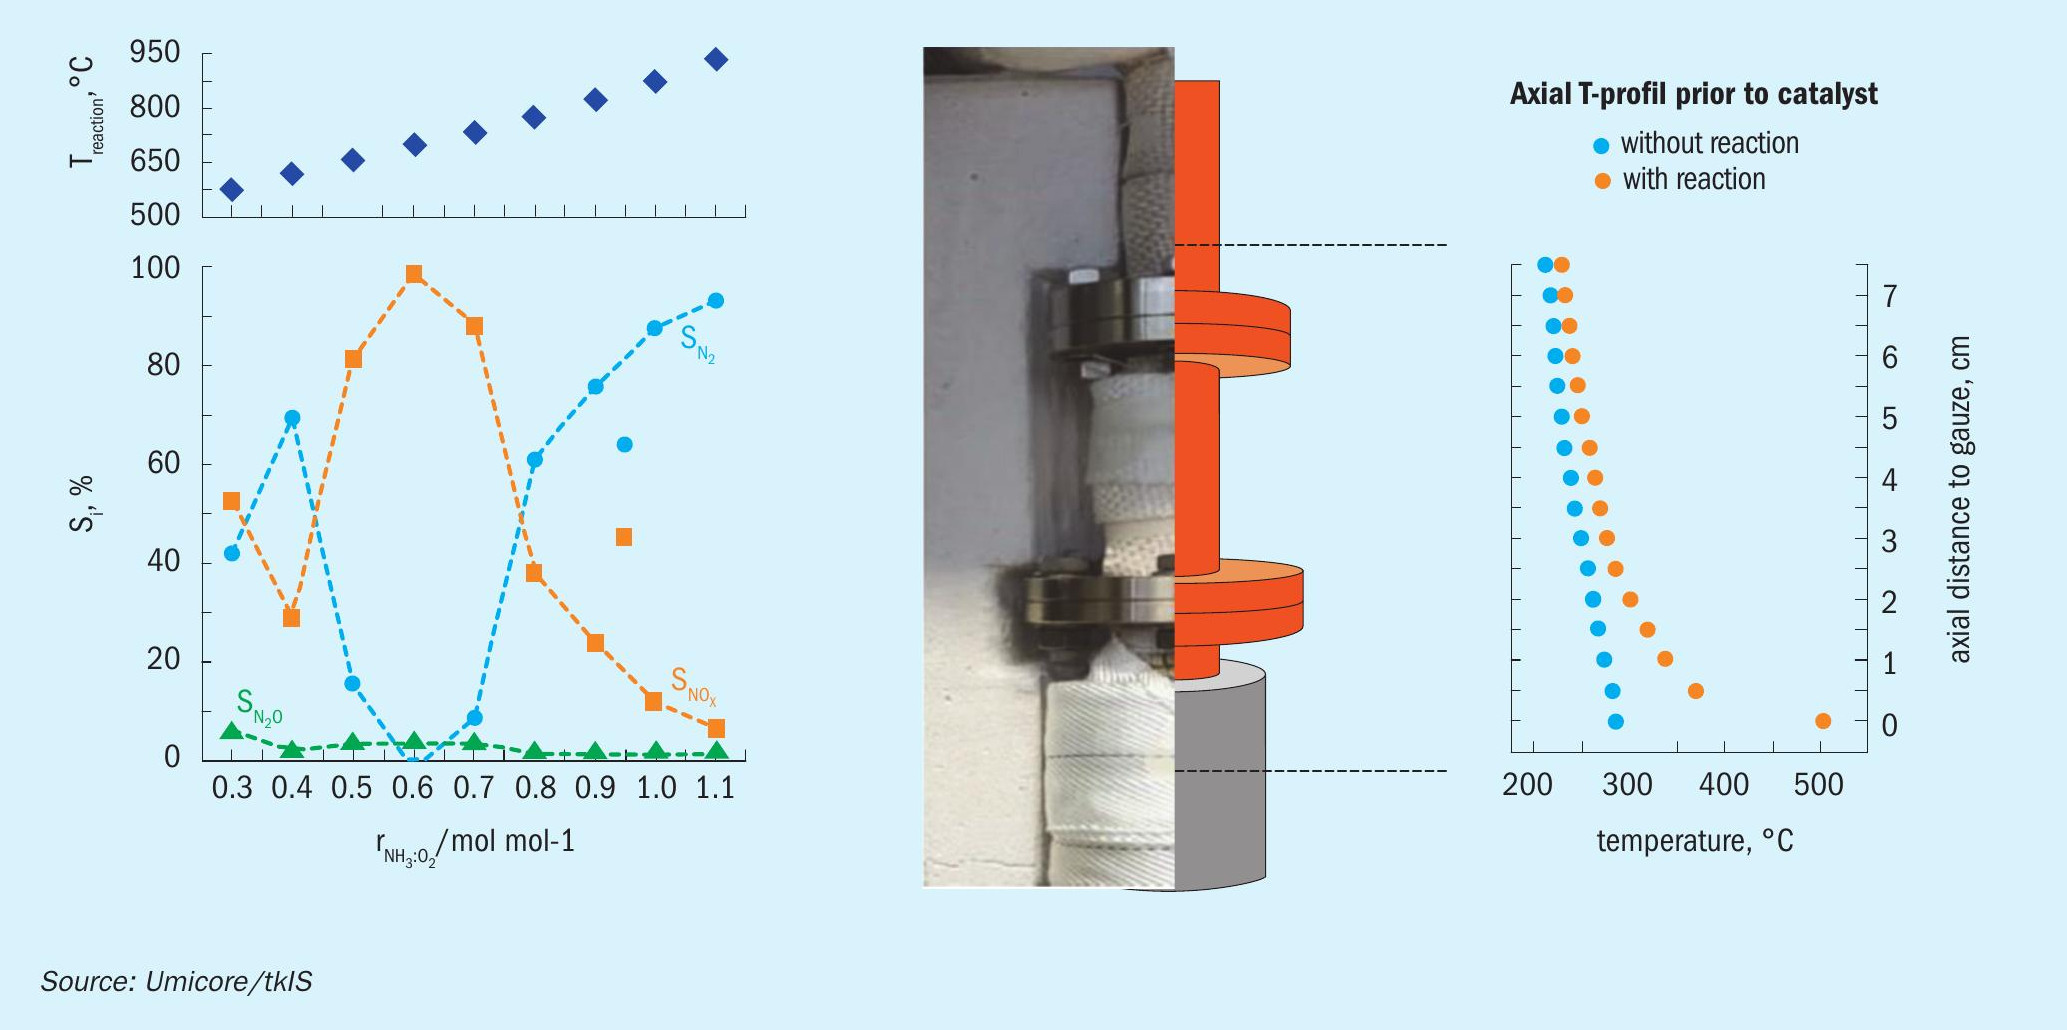
The study reveals that the lab setup allows for reproducible, time resolved experiments. Proper use of the quadrupole mass spectrometer together with a calculation routine combining complete detection of species-sensitive ion currents and consideration of cross-intensities due to isotopes and fragmentation turned out to be key. On this experimental basis parameter influences beyond traditional industrial plants could be studied as shown e.g., for the molar NH3 to O2 inlet ratio (Fig. 4). To build the foundation for further simulation and statistical data analysis the axial and radial temperature gradients of the reactor setup were determined. Additionally, geometrical and chemical modification of catalyst formulations can be quantified with regard to their N2O emission within hours instead of weeks or even months.
Modelling
In the Ostwald process ammonia is catalytically oxidised to NO in short contact times on platinum/rhodium gauzes. Besides NO as the main product, N2 and N2O are also produced. The formation of N2O is particularly critical because of its large environmental influence as a greenhouse gas.
Motivated by its large industrial importance, substantial fundamental research has been directed towards the mechanistic understanding of the process. The individual steps contributing to the overall reaction have been studied in numerous surface science studies. Furthermore, a number of mechanistic kinetic models have been published based on the surface science information. More recently, the individual steps of the mechanism were studied by quantum mechanical methods and a surface kinetic model was assembled based on this work.
Surprisingly, despite all this fundamental research, there seems to be very little published works which consider the effect of mass transfer limitation and no published work that applies the existing reaction mechanisms in a flow simulation of the platinum gauze reactor. This is even more surprising, since the reaction is known to be strongly heat- and mass-transfer controlled so that only a combined treatment of surface chemistry, flow, diffusion and heat conduction can reveal how realistic the existing kinetic models are at providing a realistic picture of ammonia oxidation under relevant industrial conditions.
This paper describes a modelling approach where a mechanistic model of ammonia oxidation on platinum previously published by Kraehnert and Baerns was implemented in a CFD simulation using the rate mapping approach. Three main application fields for this modelling approach have been handled in this work:
- geometry influence on the process performance of the catalytic gauze;
- influence of the catalyst surface restructuring on the process performance;
- CFD modelling of the laboratory scale reactor including complex chemistry on the wire gauzes.
Since ammonia oxidation is a mass transfer limited process, the geometry of the catalytic gauzes plays an important role in reaction product selectivity. Although very little scientific relevant studies have been performed in this area, investigations of different wire and gauze geometries using the combination of CFD and detailed kinetics modelling can be summarised as follows:
- Realistic temperature (900°C wire temperature) and concentration fields are obtained by the CFD simulation (Fig. 3).
- On each single wire, the N2O selectivity varies along the perimeter of the wire.
- The N2O selectivity is highest on the front side of the wire and decreases towards the rear side.
- Thicker wires show a lower N2O selectivity than thinner wires.
- The relative angle of the wire to the fluid flow has an influence on the product selectivity. Higher attack angle of the fluid on catalyst surface results in lower N2O selectivity.
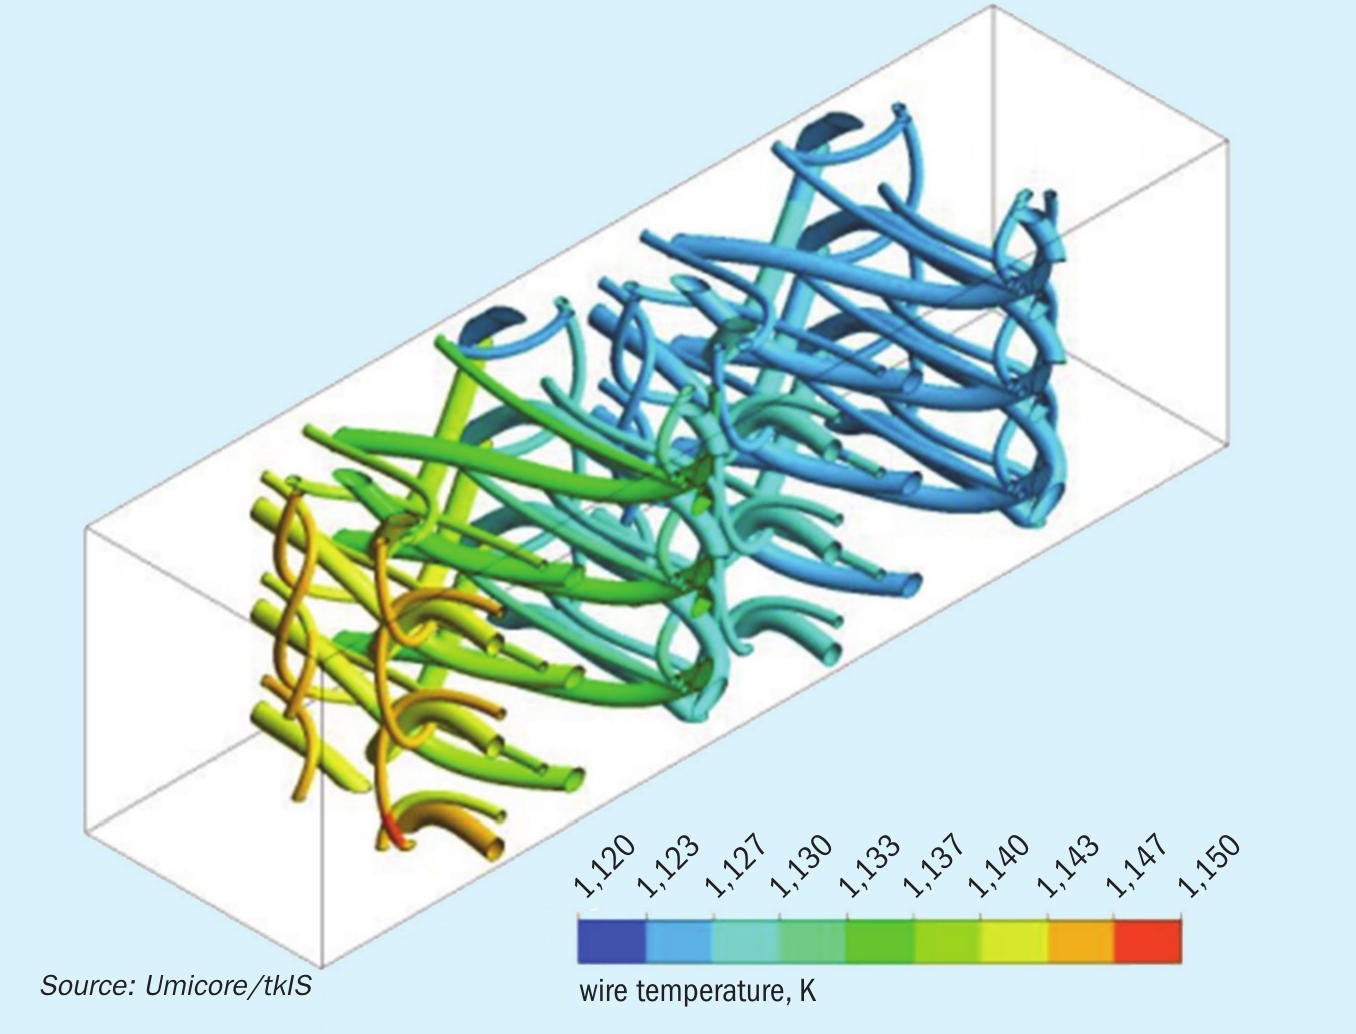
- In complex industrial gauze, the selectivity on the individual wires depends on the relative position of the wires in the gauze structure and is determined by local mass transfer effects.
- Finally, it is shown, that the simulation predicts a reduced N2O selectivity for current industrial gauze designs, compared to conventional woven gauzes.
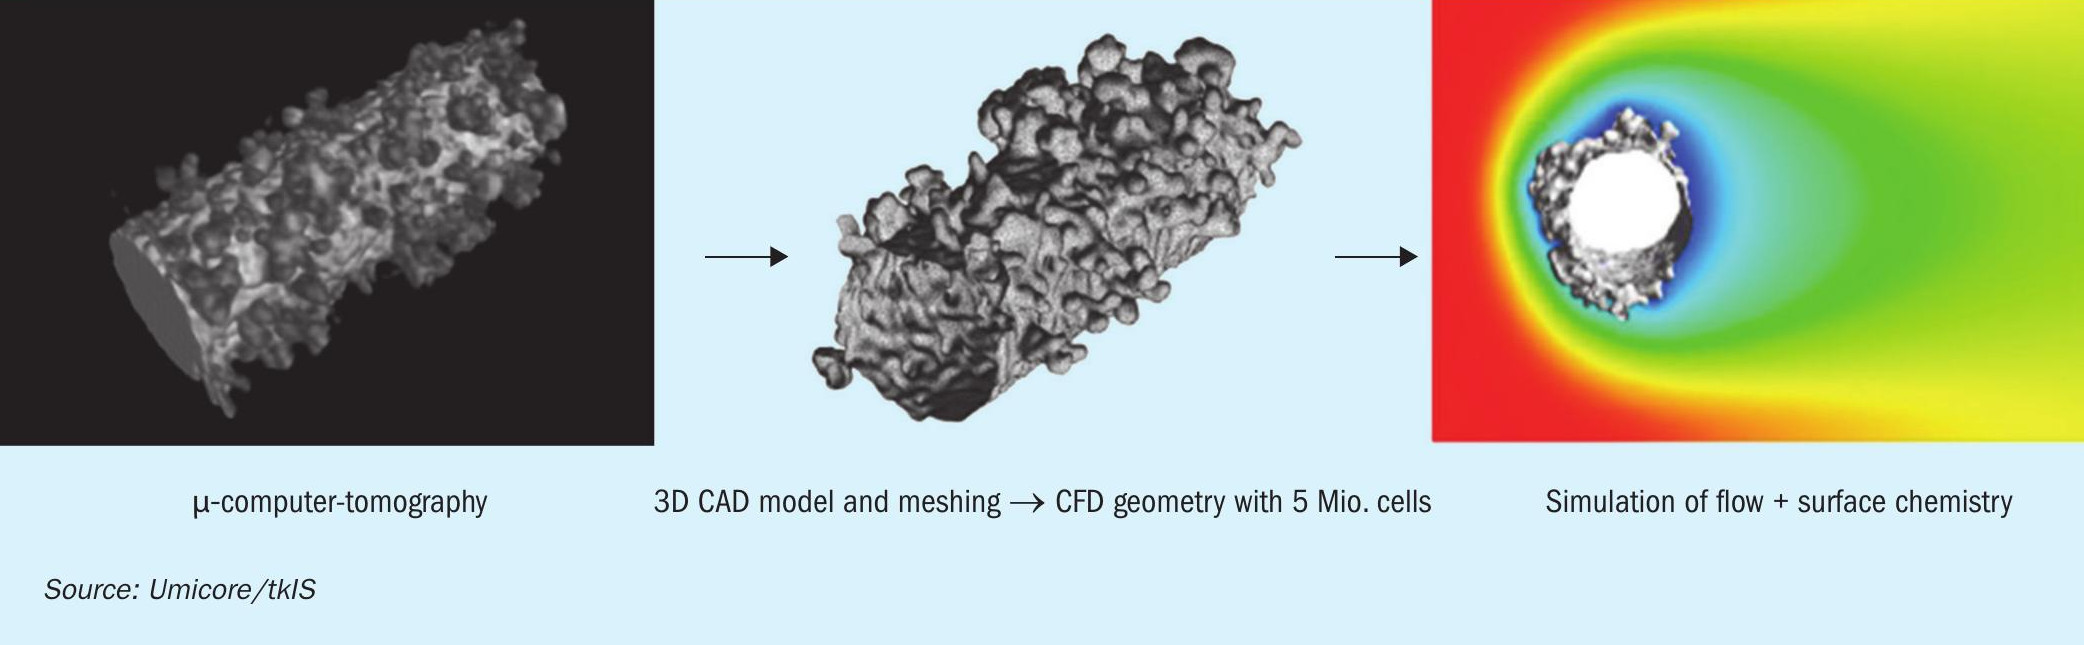
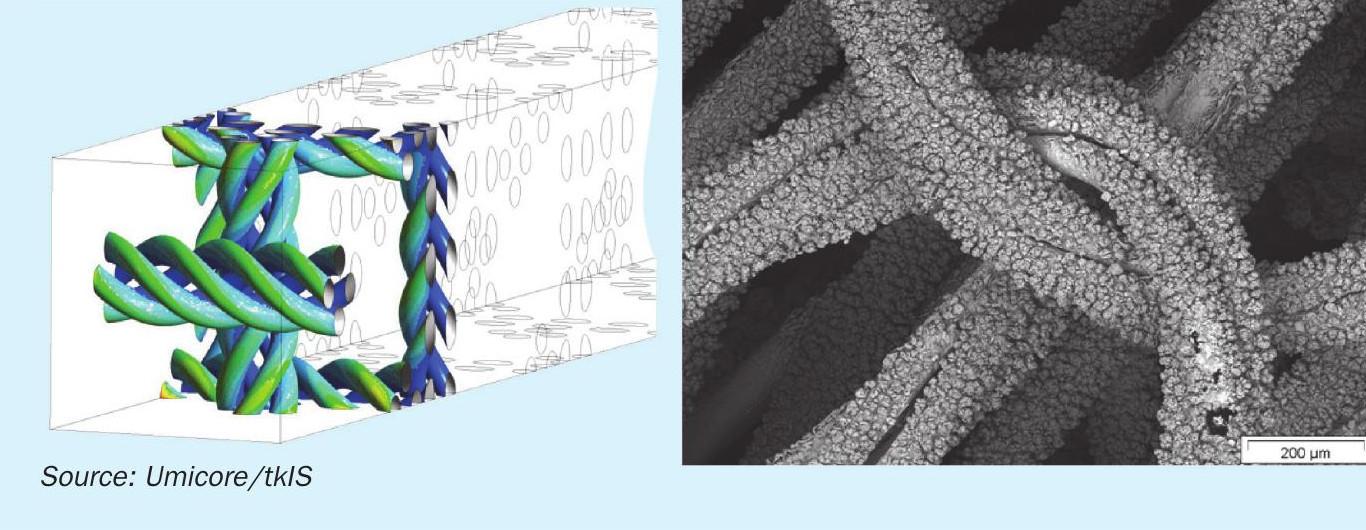
The next application field for coupled CFD and detailed kinetics modelling is the investigation of the role of catalyst surface reconstruction during the ammonia oxidation process. The surface of PtRh catalytic wires is originally smooth and became reconstructed during the reaction. So-called “cauliflower” structures can be observed on used wires after several hours under reaction conditions. A CFD model based on computer tomography images has been developed for this investigation. The simulation results show that the product selectivity (NO and N2O) is not uniform on the restructured surface. The excrescences protruding in the reaction mixture are much more involved in the reaction and the selectivity of N2O on these areas is much higher than on the wire body. It leads to a significant difference between smooth wire and restructured wire models. Although it has been shown that a surface factor, which influences the catalyst surface concentration, for smooth wire models can be adjusted in a way to reproduce the results of restructured wire model. The complex restructured wire model has to be made and calculated just once to validate the surface factor, which can be implemented then for much more simple models with a smooth wire surface (Fig. 6).
Furthermore, multi-scale simulations such as those presented in this work might offer the possibility to validate kinetic mechanisms even with imperfect laboratory reactor data, by including the imperfections of the reactor in the model and then comparing lab measurements to the model predictions.
Transfer to industrial application
The development of a technique for coupling the CFD modelling with reaction kinetics of ammonia oxidation made possible scientific based optimisation of the catalyst structure. Based on the knowledge achieved in the GreenSalpeter project a unique so-called twisted wire has been developed and patented by Umicore (Fig. 7). Intertwisting of several single wires into one string increases the active area of catalyst. The modelling of such geometry shows an increase in NO selectivity and a decrease in the selectivity of undesired by products such as N2 and N2O. This effect can be explained by a lower surface concentration of N species which leads to a suppression of reactions, where two nitrogen species take part.
The twisted wire prototype has been tested in several experimental campaigns in a laboratory scale reactor at the Technical University of Darmstadt and also in a pilot plant at Łukasiewicz Research Network – New Chemical Syntheses Institute in Puławy. Experiments have confirmed the results achieved by CFD modelling and further steps toward the industrial test has been made.
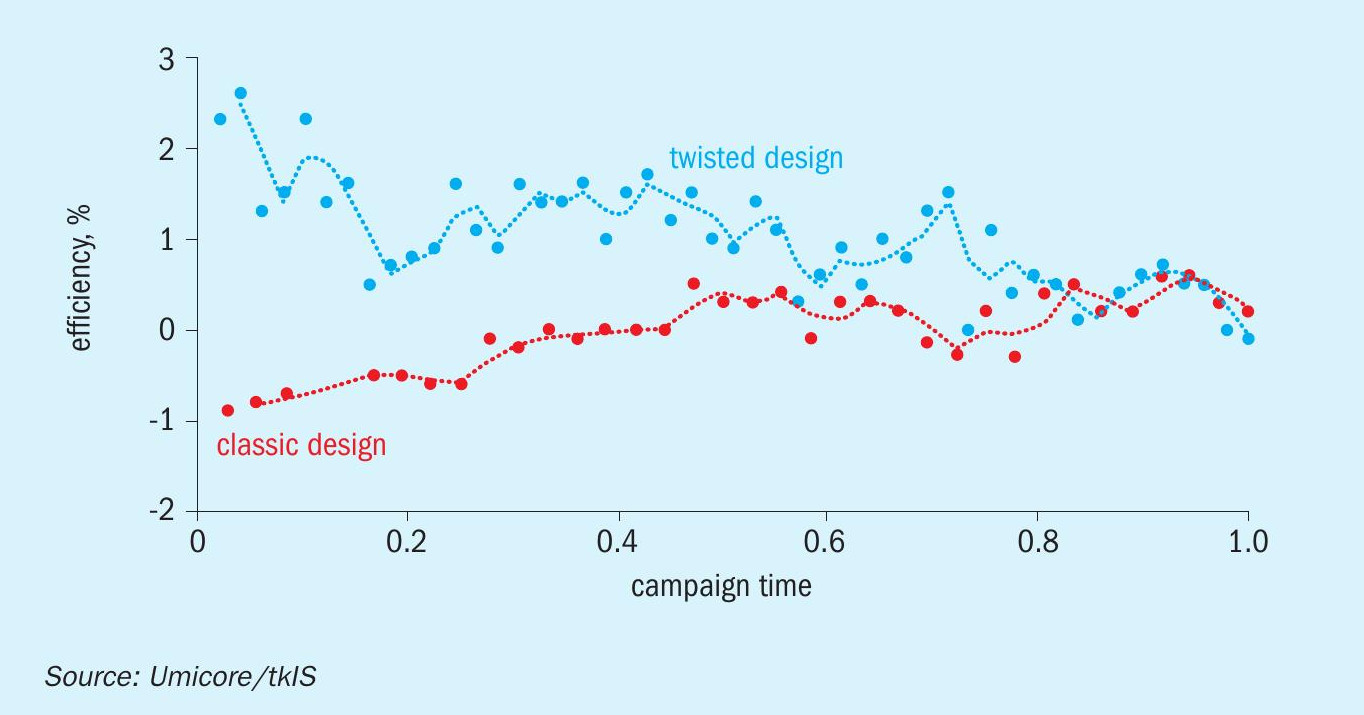
The industrial test was carried out in a medium-pressure plant in a campaign lasting for six months. During the campaign the combustion efficiency increased by 0.8 % (see Fig. 8), which is very significant considering the already very high efficiency levels of the Ostwald process. A drop in N2O emissions was also observed.
After the first successful industrial test a special industrial-scale process for wire twisting was developed by Umicore and further nitric acid plants including UKL-7 type and some high-pressure reactors were equipped with twisted wire, increasing the efficiency of the process and making it more environmentally friendly and economically attractive.
Impact on the nitric acid process and CO2 emissions
To investigate the impact of these optimisations on the nitric acid process and CO2 emissions associated with the production of nitric acid, consumption figures for typical mono medium- and mono high-pressure processes as well as a dual pressure process have been examined. The overall efficiency of a nitric acid process depends not only on the selectivity at the catalyst gauze, but also on the efficiency of the absorption.
Typically, the absorption is more efficient at higher pressures, whereas the NO yield at the catalyst gauze is lower at higher pressures. Moreover, nowadays nearly all nitric acid plants have a tail gas treatment system using additional ammonia to reduce NOx emissions. Many plants even use ammonia to reduce nitrous oxide (N2O) emissions. Therefore, the complete processes have been examined to calculate absolute NH3 savings by enhancing the NO selectivity of the catalyst by 0.8%.
Due to varying details of the processes and different plants, the accuracy of the considerations is limited. Assuming typical consumption figures of 282 kg NH3 /t HNO3 for a dual pressure process, 284 kg NH3 /t HNO3 for a mono medium-pressure process and 286 kg NH3 /t HNO3 for a mono high-pressure process, savings of more than 2 kg NH3 /t HNO3 is technically feasible (consumption figure without additional ammonia consumption for tail gas treatment). For a 1,000 t/d nitric acid plant running 350 days per year, this adds up to 700 t NH3 /a. Economic savings depend on the price of ammonia, but can be expected to be in the order of 200,000 €/a.
The impact on the climate can be assessed by considering the CO2 emissions associated with the ammonia production. Despite new developments, literally all ammonia is still produced by the Haber-Bosch process using hydrogen generated by steam reforming of natural gas. Therefore, the production of 1 t NH3 generates 1.9 t of CO2 emissions (average value, lower emission figures e.g., with modern Uhde technology). Considering the 700 t of ammonia savings of the 1,000 t/d nitric acid plant, more than 1,300 t of CO2 emissions can be saved by this single plant in one year.
However, to create a global impact it is of course not enough to equip one single plant with these optimised technologies. The global nitric acid production has already been discussed in the introduction. Assuming a minimum of 60 million tonnes of nitric acid produced per year, equipping one third of the nitric acid plants with the new technology would result in potential savings of 76,000 t of CO2 emissions per year.
Conclusion
Scientific methods such as state-of-the-art mass spectrometry for product analysis, carefully designed experimental set-ups, statistical methods for experimental designs and sophisticated computational methods involving CFD and modern kinetic models are being used to improve the understanding of the ammonia oxidation mechanism in nitric acid production technology.
Based on the results of these methods, new and optimised products are being developed. The first application of a “twisted wire” catalyst shows noticeable advantages over the conventional design. Implementation of these developments in the nitric acid industry can lead to significant cost reductions and significant CO2 emission reductions.
References
SABIN METAL CORPORATION
Optimising ammonia oxidation over platinum gauzes
Despite its long history, there have been hardly any developments and advances for the gauze catalyst for ammonia oxidation. The most notable change took place in the 1990s with the introduction of knitting technology, which resulted in greater flexibility of the catalyst gauzes at lower production costs.
Little attention has so far been paid to the link with the plant design, which, with its specific reaction environment, places fundamentally different demands on the catalyst. For decades science has devoted itself to the kinetic investigations of the surface reaction on the catalyst as well as the interpretation of recrystallisation processes and precious metal losses of the catalyst. While this may satisfy scientific curiosity, it is of little use to the plant operator to find a satisfactory answer to the question of how to optimise his individual process.
A really satisfying solution approach is the visualisation of the specific process and an individual layout design of the catalyst gauze pack based on this in order to achieve a real increase in the performance of the catalyst system.
Process visualisation
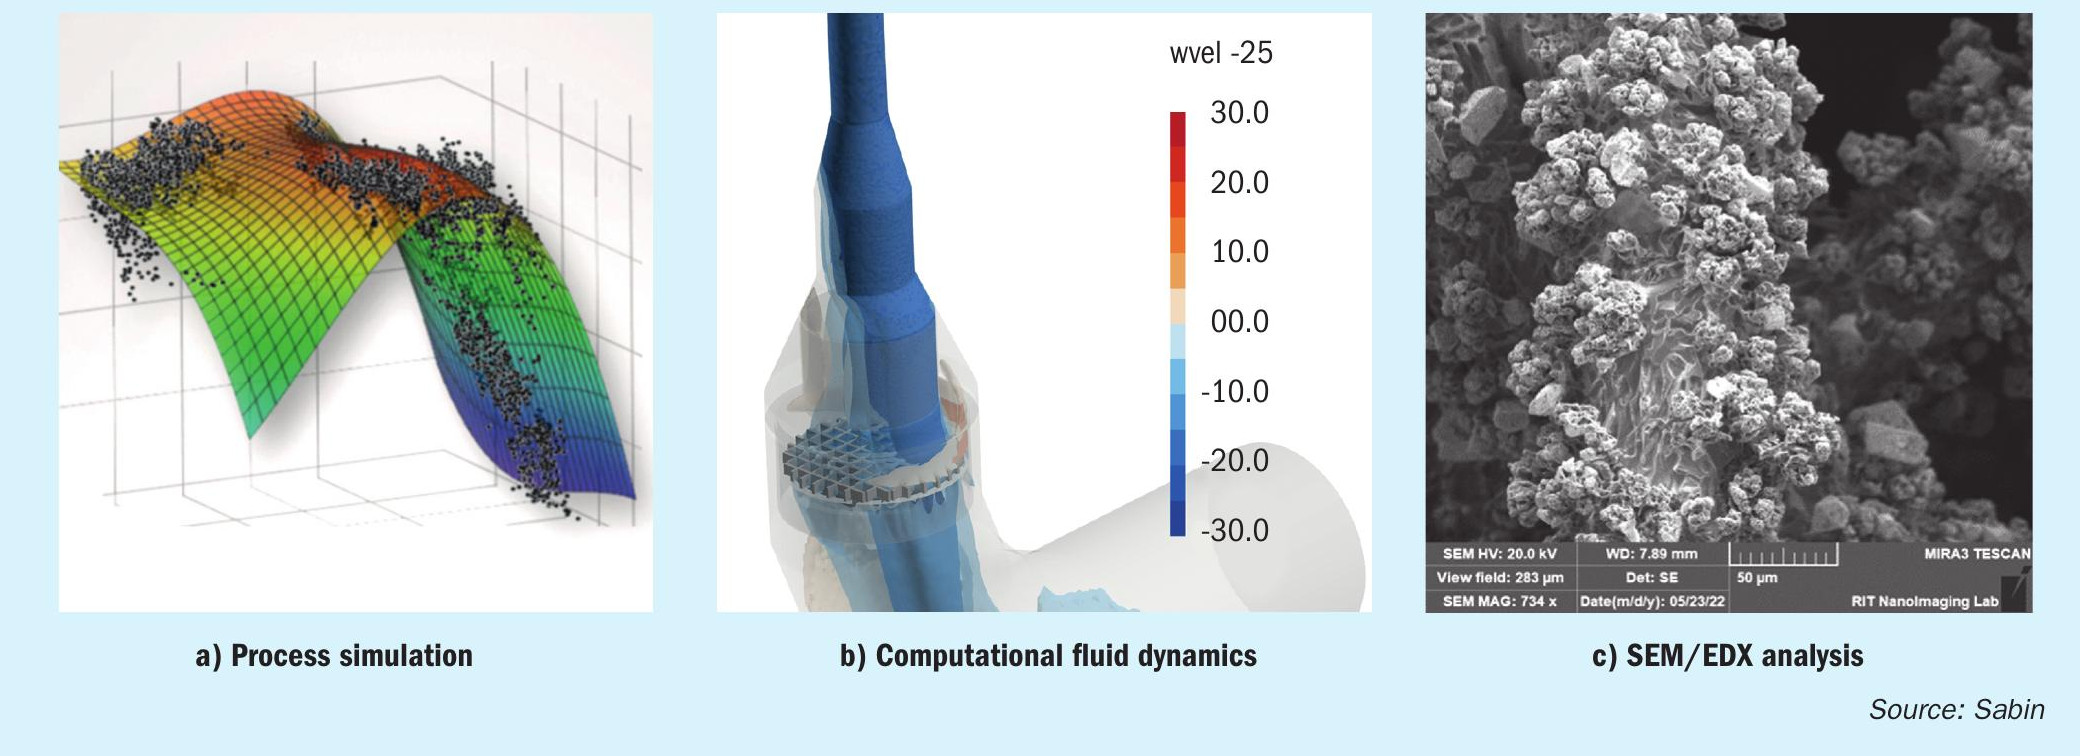
The three images in Fig. 1 include examples of Sabin’s visualisation tools, the process visualisation in process modelling and simulation (Fig. 1a), the visualisation of the individual flow characteristics using computational fluid dynamics (Fig. 1b) and the visualisation of the reaction process in the catalyst package itself using SEM/ EDX analysis (Fig. 1c).
The difficulty of process evaluation is mainly due to the fact that different process parameters are correlated with each other and in addition a temporal effect is added by the aging of the catalyst. In most cases it is not possible for the plant operator to evaluate the impact of each individual influencing factor in order to draw conclusions for optimising his process.
Especially in mono-pressure plants, the effects of absorption efficiency and catalyst selectivity are correlated via the operating pressure. In addition, the aging of the catalyst also has a temporal effect on the nitric acid process yield.
Using the three-dimensional regression analysis, the individual influencing variables can be separated from one another and brought together again in the process simulation in order to derive an optimal operating mode of the reactor.
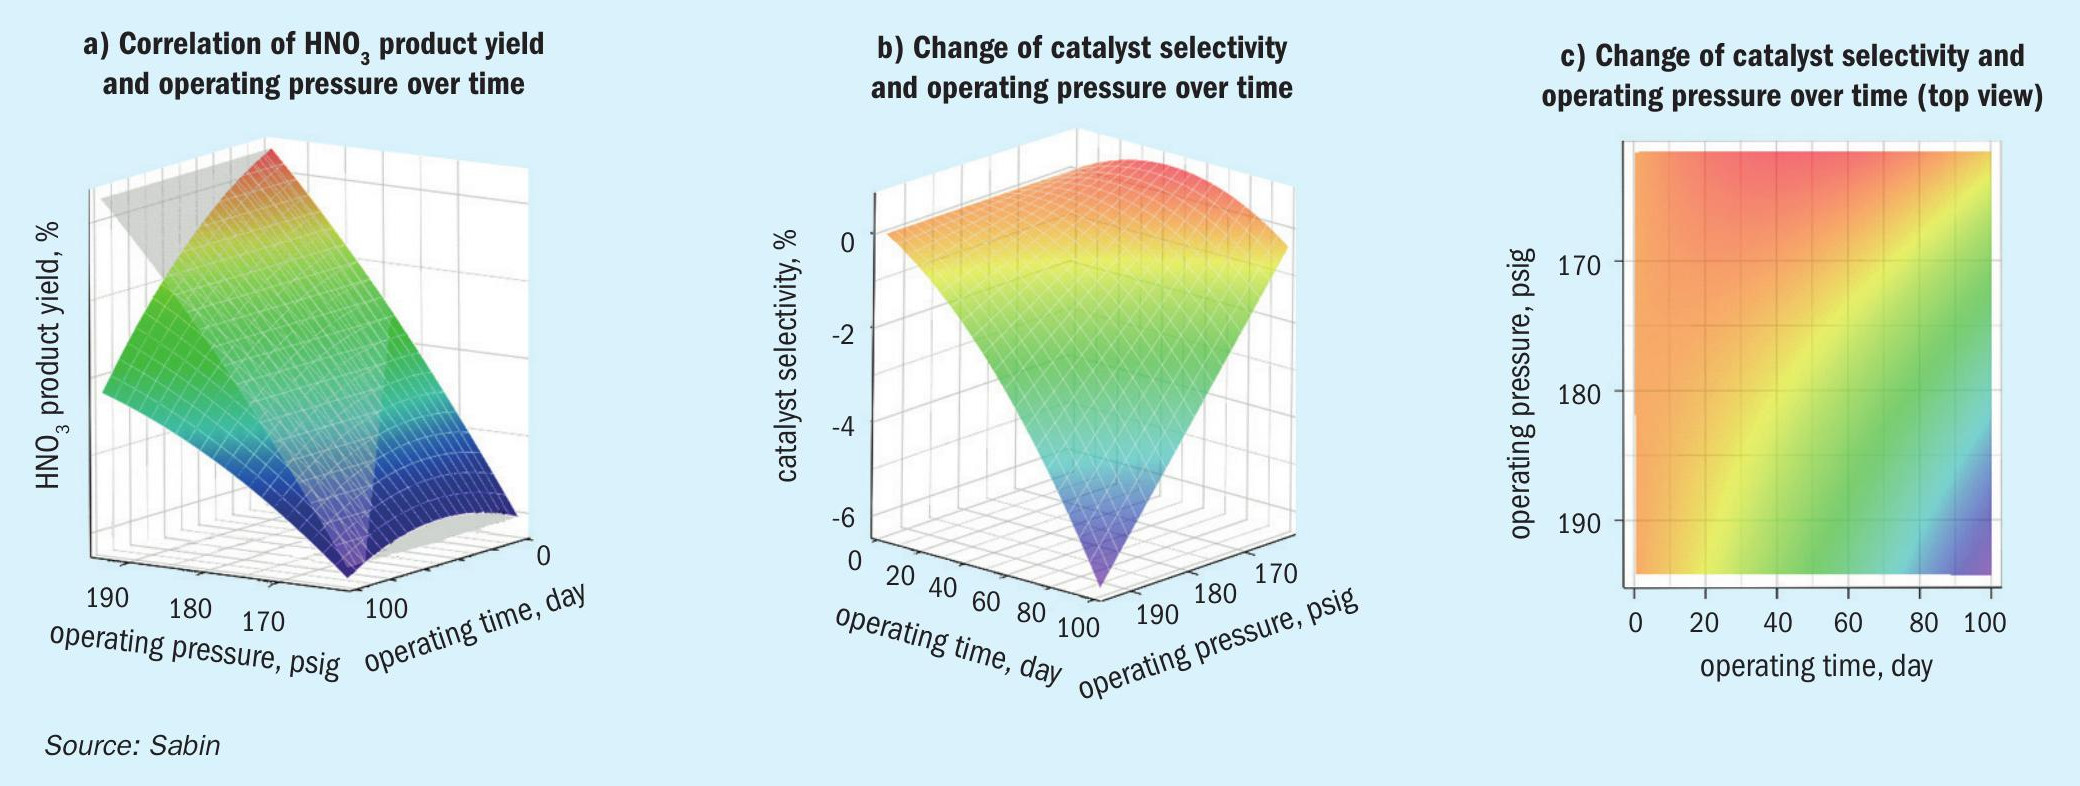
The images in Fig. 2 visualise such an approach using a case study. In Fig. 2a, the time-independent absorption efficiency (grey area) is plotted against the resulting nitric acid process yield (coloured area). The difference between the two areas results in the time- and pressure-dependent aging of the catalyst (Fig. 2b), expressed in the change in its selectivity. A time/pressure selectivity map (Fig. 2c) results from the top view, with which the course of the nitric acid process yield to be expected is shown as a function of pressure and time.
Process modelling and simulation offer the possibility of separating individual parameters from their correlations and, by combining them in the process simulation, making reliable predictions about the course of the process and the nitric acid process yield. Process modelling and simulation thus form an indispensable basis for process optimisation.
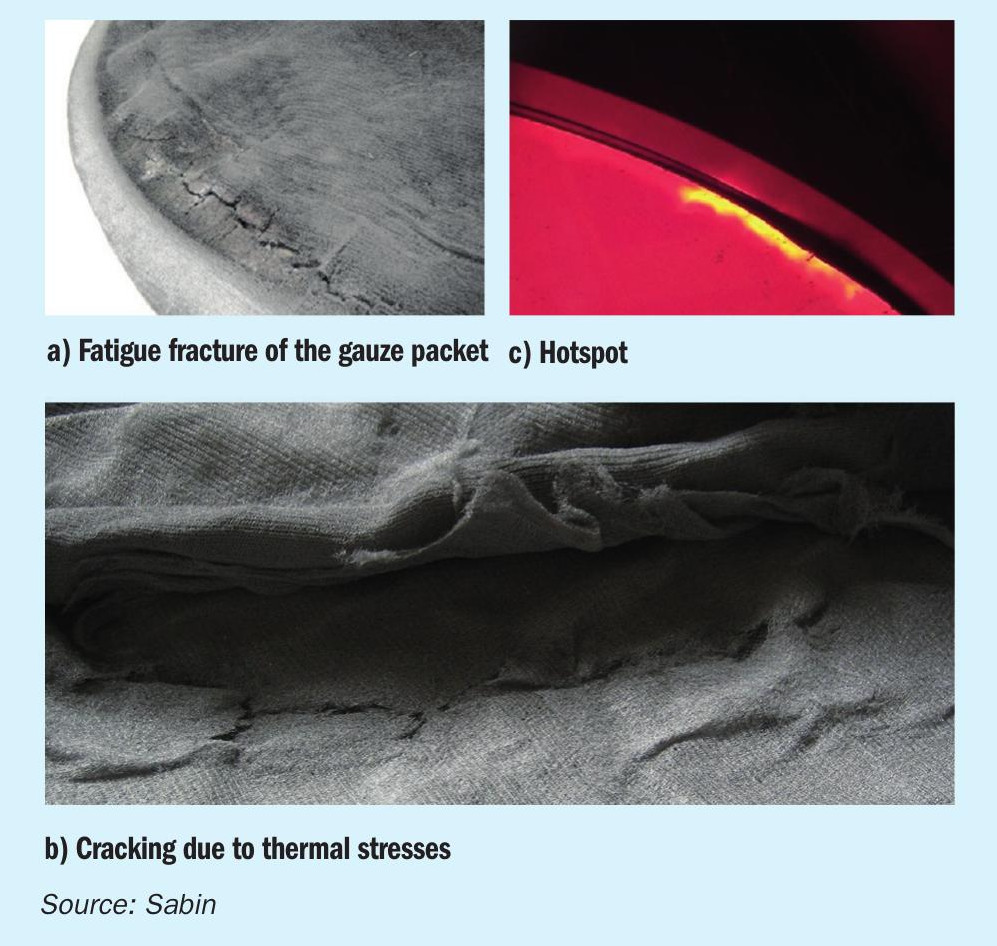
Computational fluid dynamics (CFD) enables the visualisation of the influence of flow effects on the catalyst and thus on its selectivity and aging behaviour. Indications of an inhomogeneous flow distribution over the catalyst are recurring shadows that migrate across the catalyst surface, regions with a continuously darker colour temperature, or the occurrence of hotspots.
Cracking in the catalyst pack, far from the edge zone of the catalyst pack (Fig. 3a) is due to material fatigue due to a high ammonia load, while cracking in the edge area (Fig. 3b) and the occurrence of hotspots (Fig. 3c) have their causes in thermal stresses, traced back to an inhomogeneous flow distribution.
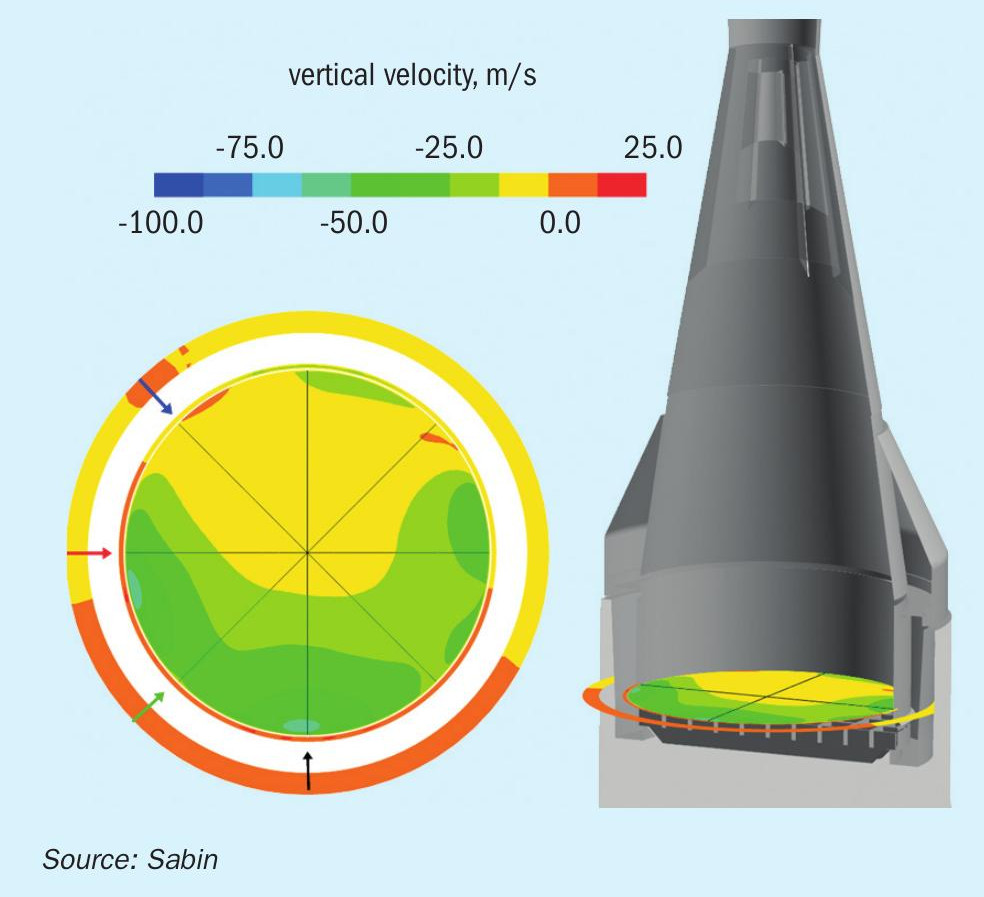
By means of computational fluid dynamics, flow effects and inhomogeneities can be visualised, a modified pipe layout as well as internals can be designed that prevent flow separation from the reactor wall, particularly at the reactor inlet. Fig. 4 shows such a calculation for a flow distributor in the reactor inlet and the resulting velocity distribution of the flow over the catalyst pack.
All the operator of a nitric acid plant sees of his process is the glowing red surface of the gauze package. With the process gas, air and ammonia are introduced into the catalyst package at a comparatively low mixed gas temperature, which react with one another on the gauze catalyst, releasing heat that is dissipated with the product gas.
The main conversion of the ammonia contained in the process gas takes place on the top layers of the gauze pack. The high heat release by the reaction results in the highest surface temperature with the highest temperature difference between the catalyst surface and the surrounding process gas. As it penetrates further through the catalyst package, the process gas becomes increasingly depleted of ammonia, while its temperature rises and the temperature difference between the catalyst and the process gas continues to decrease.
Using the SEM/EDX analysis, the course of the reaction described can be visualised in the various gauze layers of the catalyst package. The higher the surface temperature of the catalyst gauze, the more volatile platinum (IV) oxide forms on the surface, which decomposes again into oxygen and elementary platinum at significantly lower temperatures of the process gas. If this decomposition occurs close to the surface of the catalyst, agglomerates with a cauliflower-like structure are deposited on it, which become visible in the SEM analysis. From the number, size and structural composition of these cauliflower-like agglomerates, conclusions can be drawn about the ammonia conversion and the corresponding heat release on the gauze surface, as well as the temperature difference between the gauze surface and the surrounding proc ess gas.
The images in Fig. 5 illustrate this relationship between the position of the gauze layer in the catalyst package and the resulting surface morphology for increasing gauze layer positions in the flow direction of the process gas.
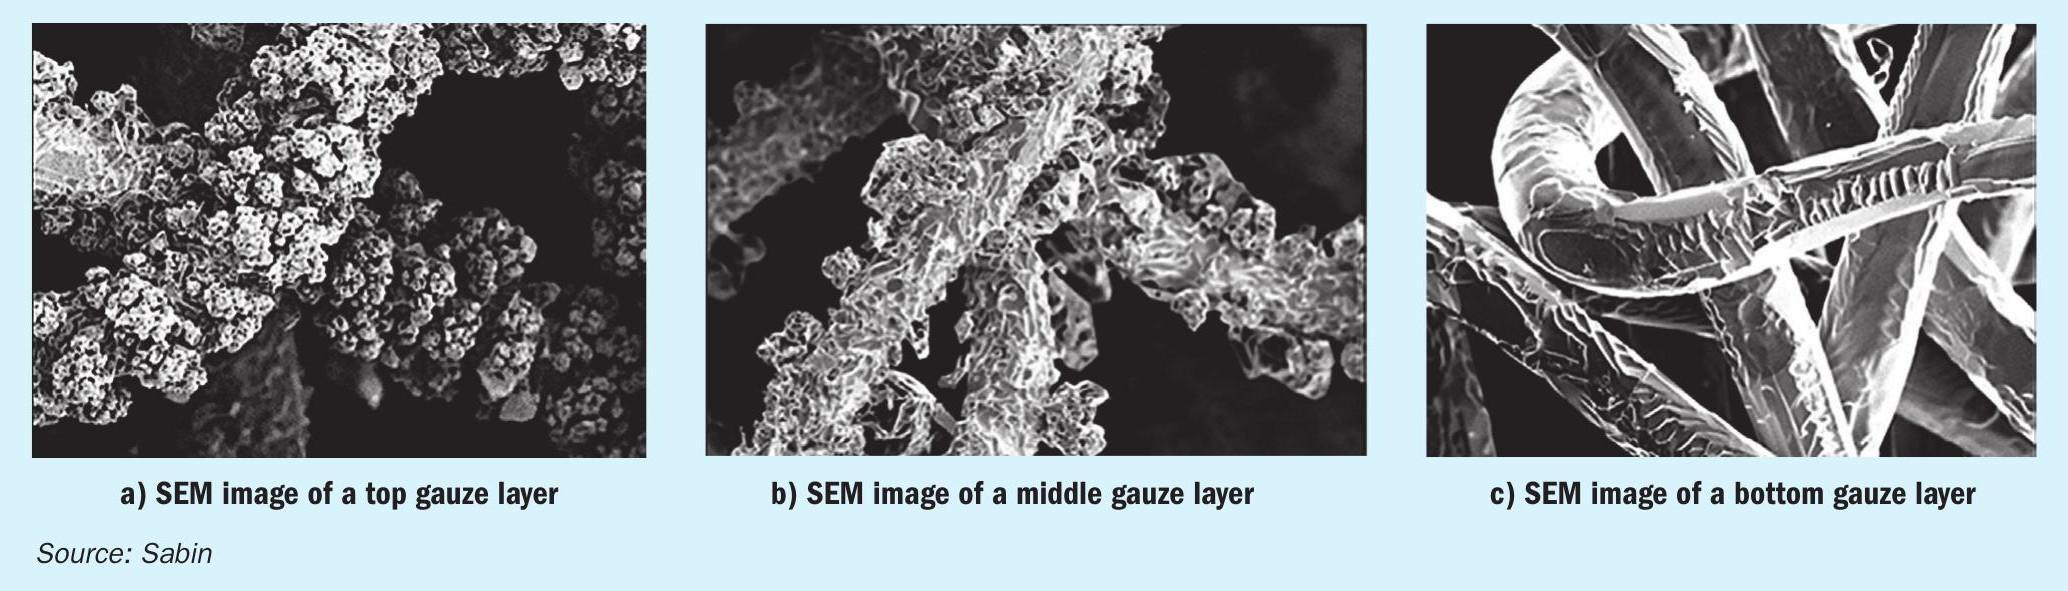
The formation of the different surface morphologies in the various gauze layers as well as the accumulation of rhodium compounds provide the gauze manufacturer with important information about the performance of the respective catalyst gauze layer according to the process conditions and thus form an important basis for the optimisation of the catalyst package with regard to the specific process conditions of a plant.
Summary
The performance of the catalyst for ammonia oxidation can only be as good as the ambient conditions allow. These environmental conditions primarily include the correlation of the process parameters and the specific flow characteristics in the reactor, which ultimately have a significant influence on the performance of the catalyst.
For the plant operator, these influencing factors result in the size of his process yield and the service life of his catalyst, without being able to establish a correlation between cause and effect.
Only the process visualisation by means of process simulation, computational fluid dynamics and the SEM/EDX analysis of gauze samples of the catalyst package after its service life provide both the plant operator and the manufacturer of the catalyst gauzes with fundamental knowledge, which enables an optimisation of the process and a layout design of the catalyst package that is tailored to the specific process parameters of the plant.
HERAEUS PRECIOUS METALS
FTC Flex designs improve catalyst gauze packs for ammonia oxidation
Catalyst gauze packs are widely used for industrial ammonia oxidation. As an expert in platinum group metals, Heraeus is an industry leader in the production of catalyst gauze packs, focusing its activities on providing products and services for the nitric acid industry. By working closely with its customers during the life cycle of their product, Heraeus strives for constant improvement for their benefit.
The economic and ecological challenges in the markets have been increasing and the nitric acid industry needs flexible answers to run its plants according to the quick changing market requirements, such as volatile raw material prices, as well as tighter environmental targets.
Increased market challenges
Platinum, rhodium and palladium are the major components in catalyst gauze packs. The high price level and the price volatility of palladium and rhodium versus platinum as well as the high raw material costs are very challenging for nitric acid producers and require a constant review of their overall costs.
In addition, there is an increasing impact of N2O emission regulations on the overall economical balance of nitric acid plants in more and more countries. Prices for CO2 certificates seem to increase continuously. New emission regulations coming into force also affect the cost benefit calculation, their cost and credits have to be taken into account for future taxes or CO2 emission prices.
All of these marked prices have a strong influence on the opex of nitric acid plants and need to be considered carefully by the catalyst supplier.
FTC Flex – quick adaptation to changing market requirements
Ammonia oxidation is the core process in nitric acid production, utilising catalyst gauze packs which provide high catalytic activity and necessary low residence time of a few milliseconds for highly efficient conversion of ammonia with air. The Heraeus “Functional Total Control (FTC) system” is a concept for the catalytic oxidation of ammonia. Heraeus introduced the FTC technology in 1995 and has been developing it continuously to meet the market challenges.
Heraeus FTC gauze packs are based on varying physical parameters and metal alloys in different gauze layers. Each gauze layer of these catalyst systems is made up of fine wires which are knitted to create 3D structures. Changing geometric structures and alloys downstream the catalyst gauze pack provide optimum performance at every catalyst gauze layer and provide high product yield as well as low N2 O emissions. Each catalyst gauze design has to be tailored to the operating conditions of the specific plant and customer requirements. A schematic representation of the FTC Flex catalyst design is shown in Fig. 1. The FTC Flex concept not only considers the plant operating conditions, but also the cost factors from market conditions to provide the catalyst gauze design with the best economic benefit for nitric acid plants.
FTC Flex system for flexible customisation
The high level of complexity of influencing parameters in the ammonia oxidation process can be mastered by computational fluid dynamics (CFD) simulation software to find the best solution for catalyst gauze designs.
Considering the catalyst reaction kinetics, the gas flow dynamics and the changes of catalyst micro-surfaces during the operating time, the catalyst simulation software allows Heraeus to find the best alloy composition and the best 3D geometrical structure of each gauze layer located at the different positions from top to bottom of a catalyst gauze pack.
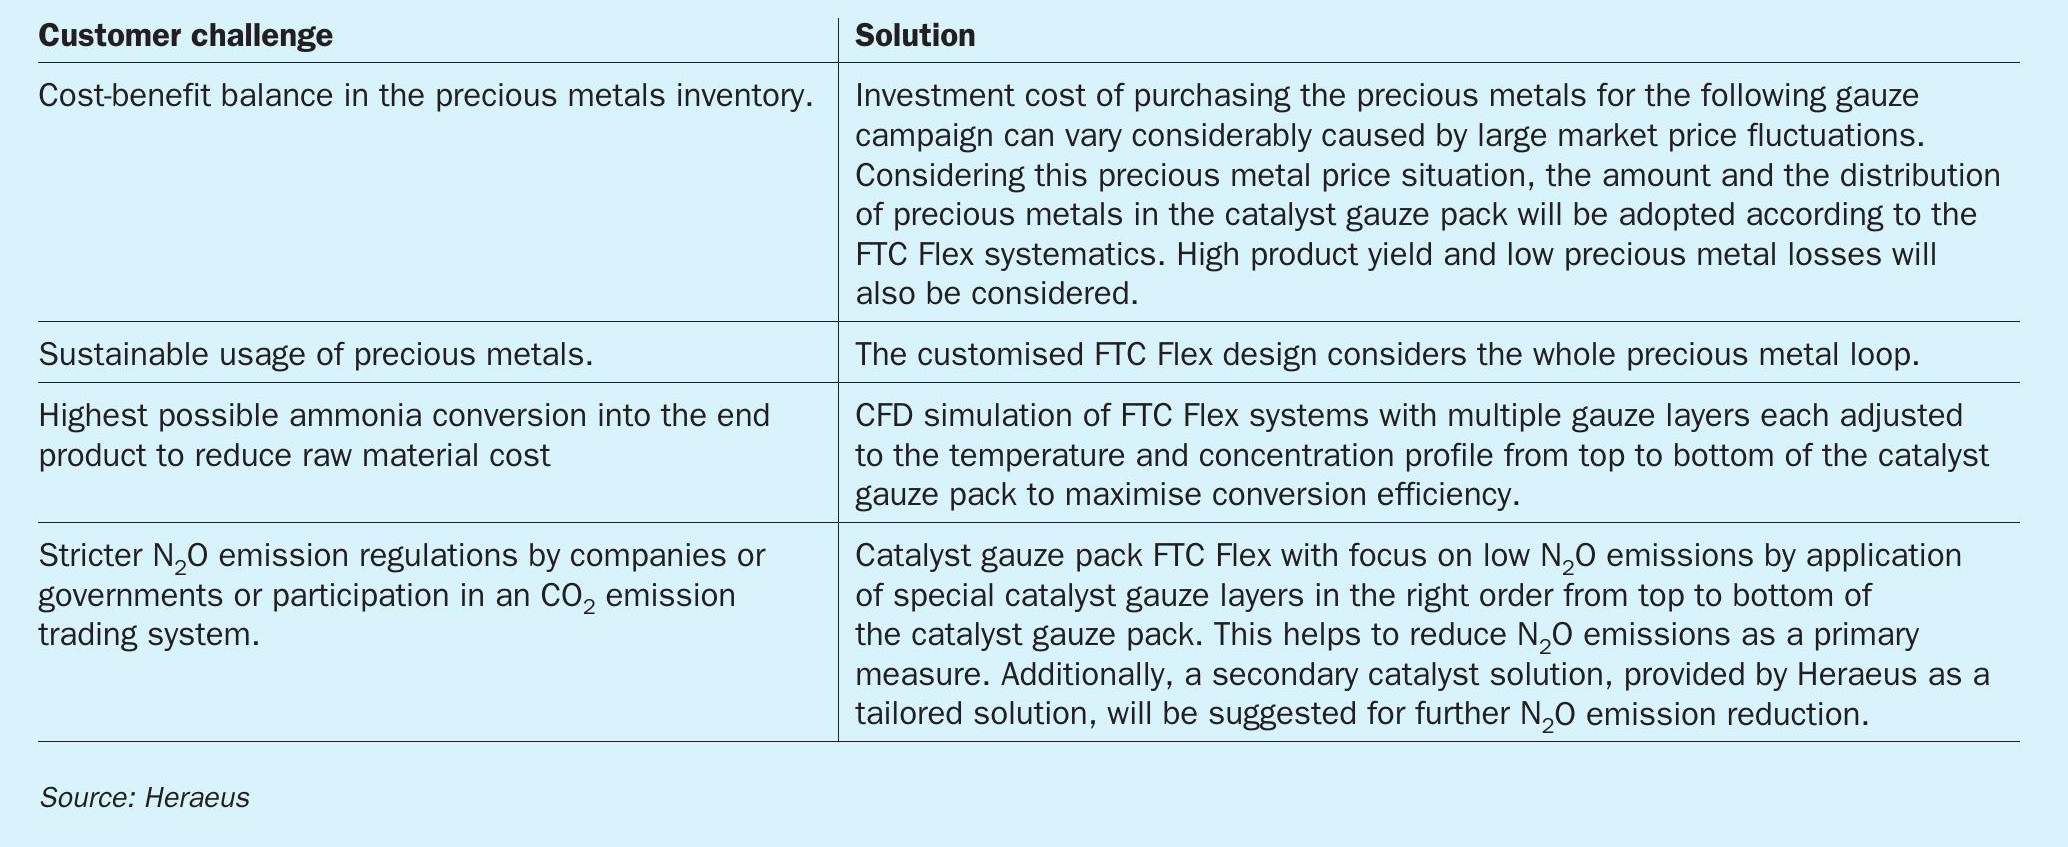
By entering the specific operation parameters of a nitric acid plant, the respective current market prices of precious metals and raw materials and including specific customer requirements, based on the CFD simulation software the most economical catalyst gauze pack is computed (Table 1).
The typical challenges nitric acid plant operators are faced with are shown in Table 1. However, the influence of the different cost factors can vary considerably. For instance, raw material prices can differ depending on the geographic locations of nitric acid plants, N2O emission regulations may be tightened or newly introduced in a country and have to be considered for the next gauze change. Hence the challenges that nitric acid plants face can vary significantly and have to be considered during the catalyst design simulation.
Corrugated catalyst gauze packs in high-pressure plants
Typically, the diameter of ammonia oxidation reactors in high-pressure plants is less than 200 cm and the plants are operated at pressures well above 10 bar absolute and at temperatures above 920°C. Because of the high gas velocity in the ammonia converters, the number of gauzes can easily require 30 to 40 layers to provide enough surface area for 100% NH3 conversion. These operating conditions cause a high pressure drop in the catalyst gauze pack and in some cases can lead to a limitation of the production throughput, if the compressor is already working at its maximum.
Heraeus has extensive experience with the global use of catalyst gauze pack corrugation in high-pressure ammonia oxidation reactors. With the wave-like shape of the corrugated gauzes a gauze design is possible which provides improved gas flow conditions throughout the catalyst gauze pack. The catalyst surface area for NH3 oxidation can be strongly increased compared to flat catalyst gauze packs. The resulting low pressure drop over the catalyst gauze pack allows the plant to be run at a higher production capacity or there will be hardly a reduction of throughput if the plant is already running close to its maximum capacity.
Under the specific operating conditions of high-pressure plants catalyst gauze packs suffer from elevated precious metal evaporation losses, leading to a significant decrease of conversion efficiency in the end of the gauze campaign.
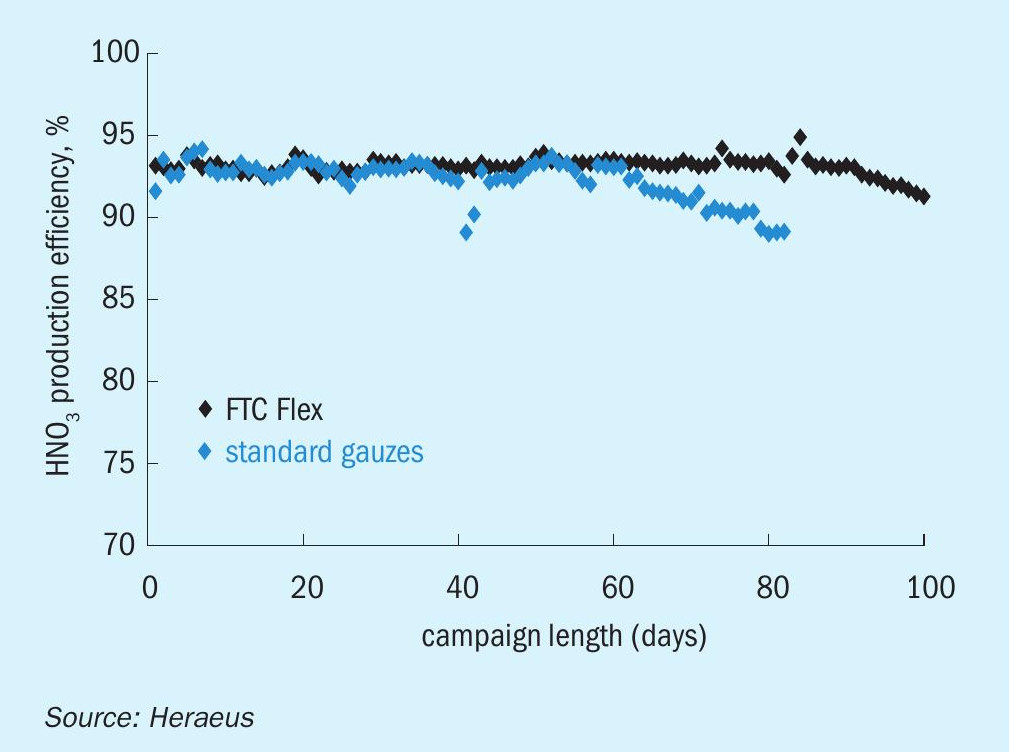
Therefore, the typical time period between catalyst gauze changes is in a range between 70 to 90 days depending on the specific operating conditions of the nitric acid plant. The special FTC Flex design of the corrugated catalyst gauze pack provides better gas flow conditions and higher conversion efficiency, in particular at the end of the gauze campaign, which leads to longer service time of the catalyst gauze packs and improves average HNO3 yield. Fig. 2 shows the conversion efficiency over operation time in an industrial high-pressure plant using standard gauze design which resulted in a service time of about 80 days, compared to an FTC Flex gauze design that extended the service time to 100 days.
N2O emission reduction
During ammonia oxidation a minor amount of N2 O is produced in undesired side reactions. The formed N2 O cannot be absorbed downstream and hence is released into the atmosphere as a byproduct. N2 O is well known as one of the greenhouse gases and has roughly 300 times the global warming potential of carbon dioxide and is therefore a major factor in global warming. More than 60 million tonnes of nitric acid are produced around the world annually, with an estimated 500,000 tonnes of nitrous oxide generated as a byproduct – equivalent to the carbon dioxide emissions from over 60 million mid-sized cars.
In more and more countries N2O emission regulations will come into force in the near future, and others continuously tighten the emission limits or increase the costs for environmental emissions. This puts additional pressure on nitric acid producers to reduce the N2O emissions in their plants.
Good experiences with technical solutions to reduce N2O emissions have been available for many years. All technical solutions use special N2O reduction catalysts which can be positioned either directly under the primary catalyst gauze pack or in the tail gas of the plant.
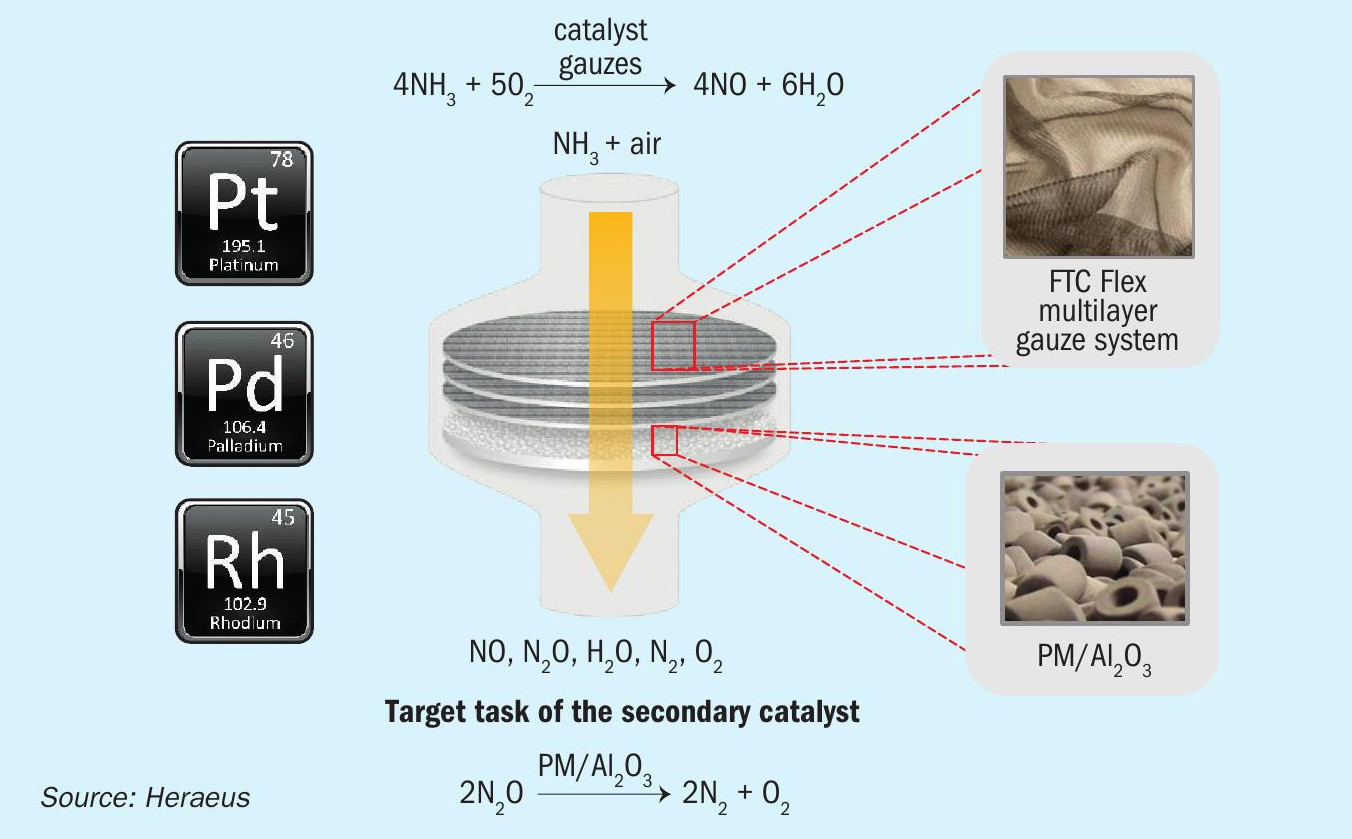
If there is enough space between the catalyst gauze pack as primary catalyst and the cooling system of the product gas, a secondary catalyst can be applied directly under the catalyst gauze pack as shown in Fig. 1.
Using the design principles of FTC Flex, Heraeus catalyst gauze packs in combination with an iron-oxide based secondary catalyst can achieve average N2 O emissions of less than 50 ppmv in the tail gas of medium-pressure plants. This catalyst combination is being used successfully in many nitric acid plants worldwide.
However, since N2O is generated on the catalyst gauze pack, the most cost-effective solution will be a further reduction of the N2O formation directly at this stage. Nowadays, N2O emission reduction has become an important parameter for the cost evaluation of nitric acid production in many countries.
While N2O emission reduction technology is often used in medium-pressure plants, there are only a few high-pressure plants which use an N2O emission reduction technology. The production capacity is smaller compared to medium-pressure plants and the absolute figures of N2O emissions are lower. However, more and more operators of high-pressure plants are requesting technologies to reduce the N2O emissions from their plants because of rising costs of emissions or to affirm the green image of the companies. Heraeus has been developing a combination of primary and secondary catalyst technology with relatively low pressure drop for this application.
Heraeus has more than ten years of experience with this N2O reduction technology in high-pressure reactors. During this time the primary FTC-HR gauze technology in combination with precious metal coated Raschig ring catalyst, as shown in Fig. 1, have been developed. This resulted in the new FTC Flex gauze type with a focus on high N2O reduction during the CFD simulation process.
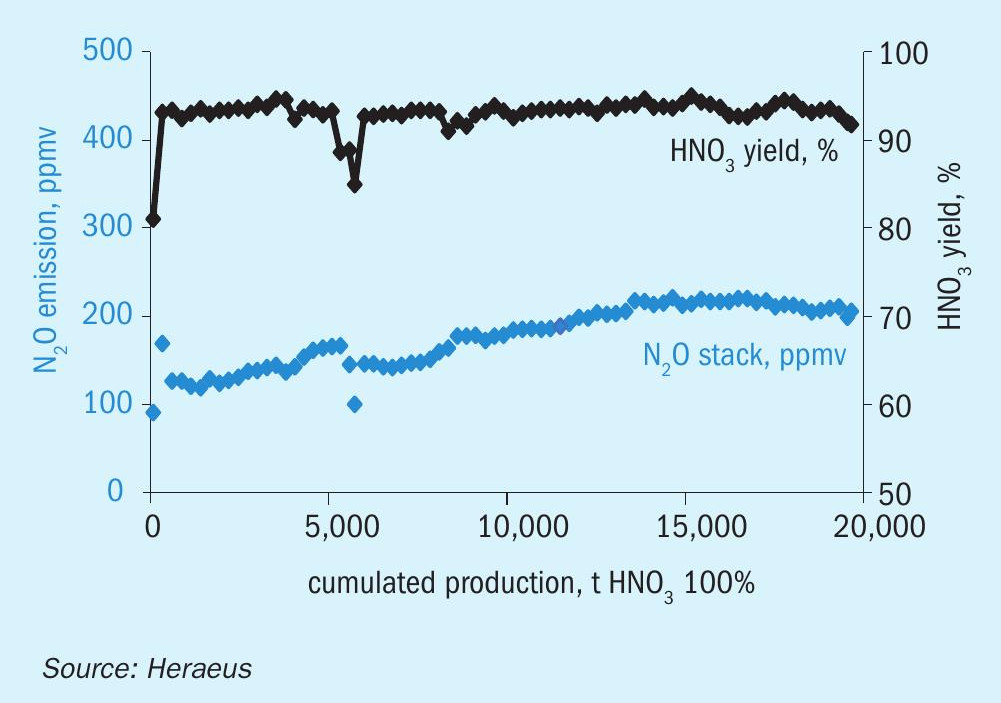
Because of the special operating conditions of high-pressure plants, the pressure drop arising from the primary and secondary catalyst system is an important parameter which limits the amount of the secondary catalyst. Nevertheless, in some industrial high-pressure reactors the combination of primary and secondary catalyst systems could be used successfully to reduce N2O emissions. In those plants N2O reduction rates of 80-90% could be achieved without limitation of the HNO3 throughput and at expected HNO3 yield (see Fig. 3). In general, the application of this type of N2O reduction system depends on the reactor design and acceptance of a certain pressure drop at the ammonia conversion reactor and needs to be adjusted for each high-pressure plant.
JOHNSON MATTHEY
Nitrous oxide emissions reduction from nitric acid plants
Nitrous oxide (N2O) is a recognised greenhouse gas with a global warming potential 265-298 times that of carbon dioxide. Nitric acid plants contribute a significant part of the greenhouse gas emissions from industry with N2O emissions estimated at 350,000 tonnes per year corresponding to 100 million tonnes of carbon dioxide (CO2e). For industrial nitric acid production, the most effective method of producing the desirable nitric oxide gas (NO) is by combustion of ammonia and air over a platinum group metal (pgm) catalyst.
On an industrial scale this reaction is normally performed over a platinum group metal (pgm) gauze in pressure vessels of up to 5m in diameter. A highly desirable solution is the in-burner destruction of N2O using a world beating ceramic catalyst developed by Yara (YARA 58-Y1). The operating conditions immediately below the pgm catalyst create mechanical challenges that must be overcome and the paper describes how Johnson Matthey (JM) has overcome these challenges to deliver system solutions that allow greater than 90% abatement. The system solutions are widely used throughout the world with JM’s experience contained in a range of highly engineered units covering a wide range of applications, where development of designs allow successful operation of the catalyst in the diverse range of existing plants.
JM’s global marketing and engineering capabilities coupled with the catalyst with Yara’s expertise in N2O abatement catalyst offers the world’s nitric acid industry the leading N2O secondary abatement technology.
The nitric acid production process
Nitric acid is produced through contacting NO2 with water. The NO2 is produced by combusting ammonia with air using a platinum/rhodium gauze to create NO. The combustion itself has three possible reactions
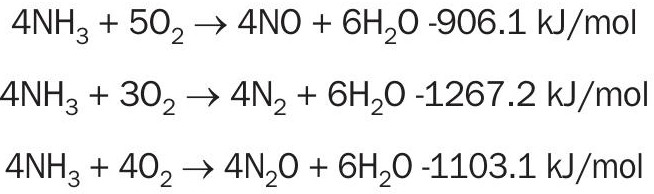
Two of these reactions do not produce NO and are therefore undesirable. They are avoided by running the combustion at a high temperature and at a low residence time. The ammonia combustion takes place at a temperature of around 850°C. Once the main combustion is done NO is oxidised to NO2 non-catalytically and the resulting NO2 is contacted with water to produce the nitric acid.
The creation of N2O happens not only in the combustion itself, as seen above, but also in reaction with the produced NO, as shown below.
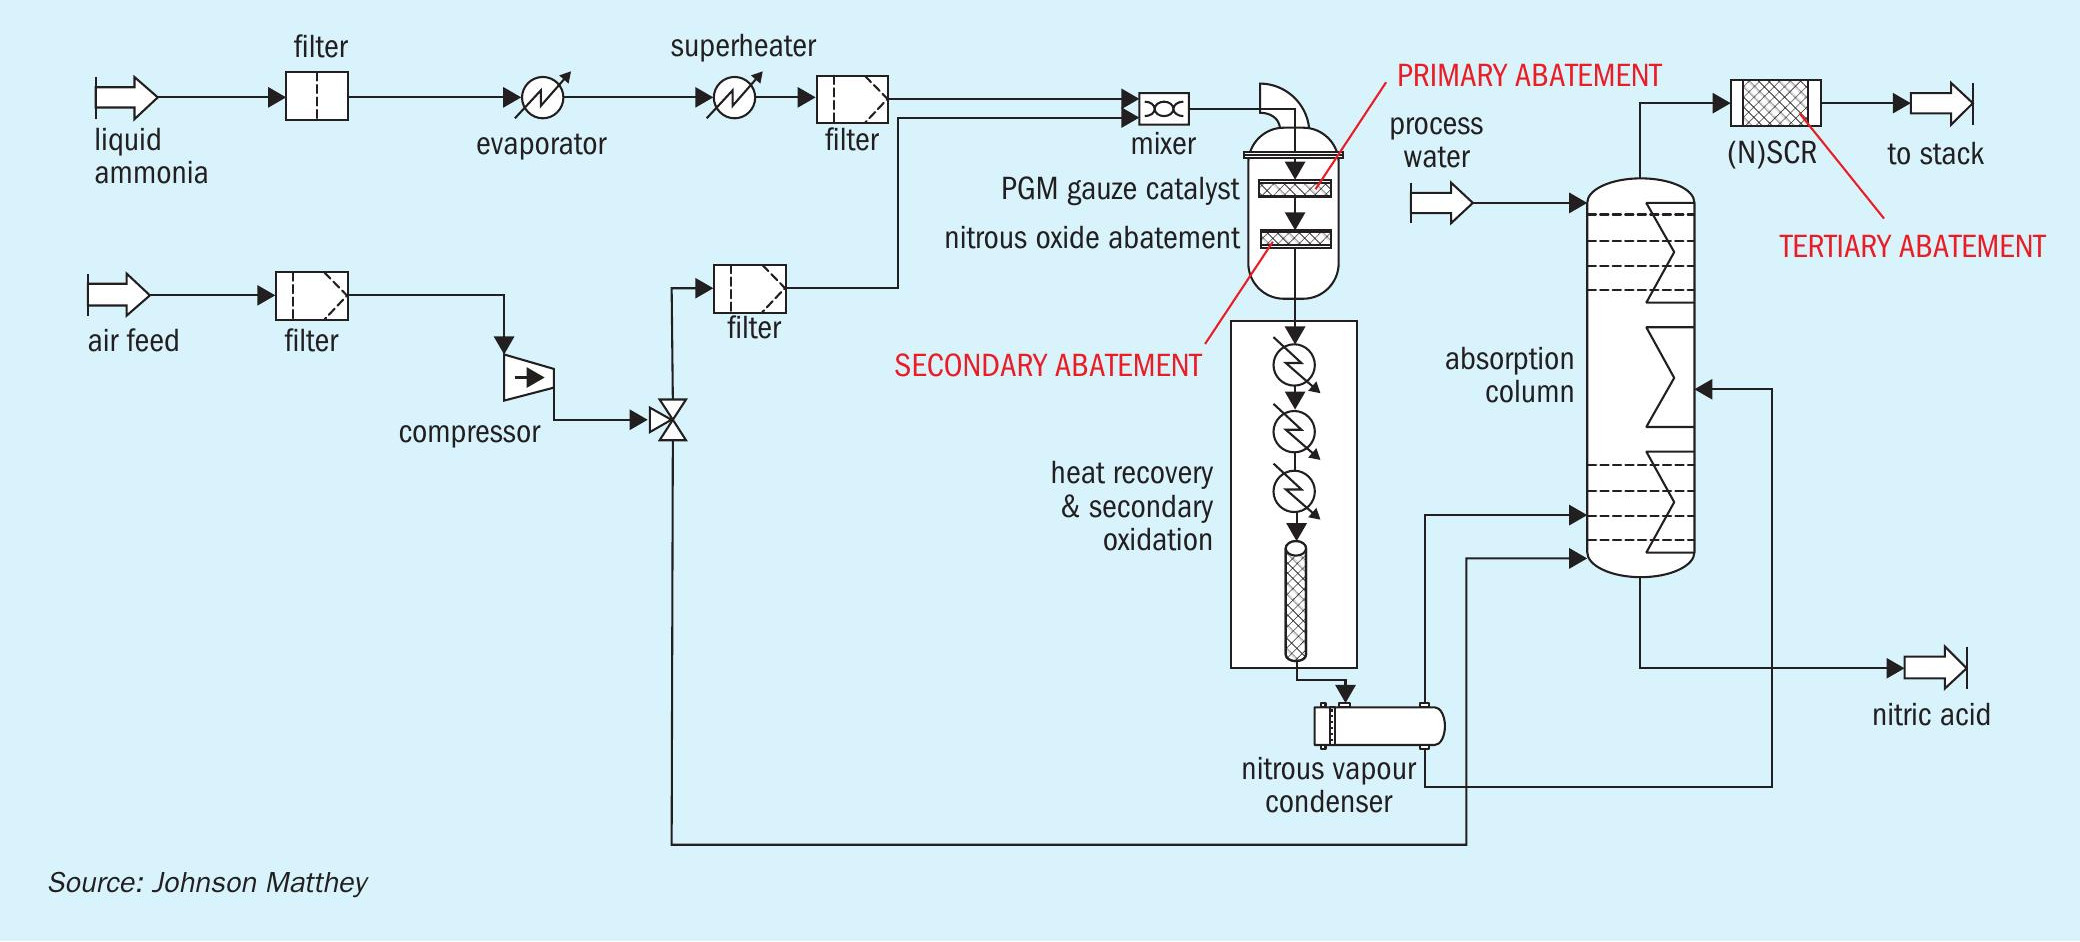
A flowsheet of a nitric acid process is shown in Fig. 1.
Although most of the NOx is recovered in the absorption tower some leaves the top of the absorber in the tail gas and must be treated, as its release is considered unacceptable. Two main processes for catalytic NOx removal are currently used, selective (SCR) and non-selective catalytic reduction (NSCR). Many older plants used NSCR, which removed both NOx and N2 O. However, as NSCR is both costly and leads to cross media emissions, most modern plants use selective catalytic reduction which does not remove N2O.
Although it possible to add an additional end-of-pipe abatement step (tertiary N2O abatement), the capex required to modify existing plants can be significant.
This article discusses a solution in which N2O abatement catalyst is placed immediately under the primary catalyst platinum/rhodium gauze – so called secondary catalyst N2O abatement.
Abatement options
There are three main N2O abatement approaches.
The first option is to ensure that the primary catalyst being used is based on the best available technology.
Secondary nitrous oxide abatement catalysts have been available for over 20 years. The catalyst is generally in the form of ceramic pellets and is installed directly under the primary catalyst. As high temperatures are generated from the oxidation of ammonia, relatively small volumes of secondary catalyst can achieve high levels of abatement. This high temperature does, however, present some difficulties in maintaining uniform gas flow through the pelleted bed, preventing gas by-passing the pelleted catalyst and minimising the movement of pellets through thermal cycling.
Tertiary nitrous oxide abatement remains a popular option and although very high levels of performance can be achieved the capital costs for such installations can be prohibitive.
Innovation
The Kyoto Protocol was the world’s first climate change agreement that attempted to limit and reduce greenhouse gas emissions. Nitrous oxide (N20) is a recognised greenhouse gas with a global warming potential 265-298 times that of carbon dioxide (CO2) for a 100-year timescale1 . According to the 5th Assessment Report of the Intergovernmental Panel on Climate Change (IPCC) from 2013, the concentration of N2O in the atmosphere has increased by a factor of 1.2 since pre-industrial times and N2O has become the third largest contributor to climate change2 . The two industrial processes contributing most to N2O emissions are the production of nitric acid and that of adipic acid. N2O emissions from nitric acid and adipic acid production contribute to about 0.2% of global emissions (roughly 100 MtCO2 eq), which is equivalent to 24% of non-CO2 greenhouse gas (GHG) emissions from key industrial processes3 .
On an industrial scale this reaction is performed in pressure vessels typically from one to five metres in diameter, with the catalyst supplied in the form of gauze. Even with the best oxidation catalyst some by-product N2 O will always be formed and emitted into the atmosphere. Abatement technology will reduce, but not eliminate these emissions. Although end-of-pipe technologies can remove N2O from the gas system before venting to atmosphere, such installations are not always feasible and have a high capital cost. A more desirable solution was recognised as in-burner destruction of N2O. To achieve this, some fundamental problems had to be overcome. The ammonia oxidation reaction is exothermic and results in catalyst temperatures in excess of 800°C. A pelleted catalyst was developed by Yara that could operate under such conditions to abate more than 90% of the N2O generated across the gauzes. However, at these temperatures, the burner in which the gauzes are contained undergoes considerable expansion. Although gauzes can readily accommodate such expansion, this is not always the case with pellets and an engineered solution was therefore required that would prevent the potential for gas bypassing if the catalyst is not free flowing.
JM’s marketing and engineering capabilities were combined with Yara’s cooperation to offer this N2O abatement technology to the world’s nitric acid industry.
Today the catalyst is widely used throughout the world and is installed in a range of highly engineered units. JM’s experience across a wide range of catalyst applications combined with extensive design knowhow in this and other sections of the chemical industry, allowed the development of designs for the mechanical modifications which allow successful operation of the catalyst in a diverse range of nitric acid plant designs. These modifications vary from minor changes to prevent loss of catalyst, to a unique design which can be retrofitted easily into plants with the most arduous operating conditions for the abatement catalyst. This innovative technology combines high catalytic activity and long-term stability under conditions of high temperature and thermal stress. The catalyst withstands normal impurities present in the gas and has no impact on the combustion reaction taking place in the burner.
Main considerations
As with any investment in technology several considerations need to be made in order that the correct discussions are made on the best available technology and if this technology can be futureproofed to protect any investment against subsequent changes in legislation.
- Will this technologies performance meet current and likely future legislation?
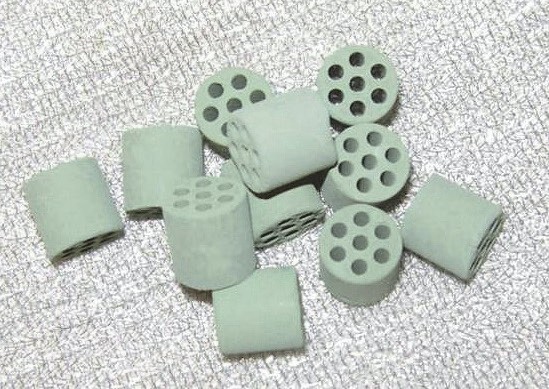 Fig. 2: Leading secondary N2O abatement catalyst Yara 58-Y1.PHOTO: JOHNSON MATTHEY
 - What other investment costs are there?
- What operational costs are there?
- Will there be monitoring costs?
- Will the N2O abatement technology adversely impact nitric acid production?
Yara 58-Y1 N2O abatement catalyst
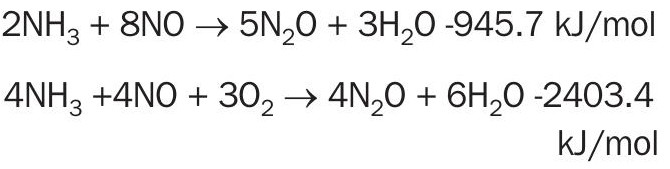
Yara’s N2O abatement catalyst (Fig. 2) is a cerium oxide-based catalyst with a cobalt compound as the active component and has been optimised for decomposing N2O to nitrogen and oxygenx at temperatures of 800-900°C. The catalyst is offered as a multi holed cylindrical pellet with excellent thermal stability and a 2,000°C melting point.
JM have successfully installed N2O catalysts into a range of low-, medium- and high-pressure plants worldwide, with abatement of over 90% being achieved. The Yara 58-Y1 N2O abatement catalyst has no impact on nitric acid production and can be easily installed.
As well as high levels of abatement, this stable catalyst offers several benefits, including:
- low pressure drop;
- long lifespan;
- resistance to sintering;
- no risk of downstream pollution.
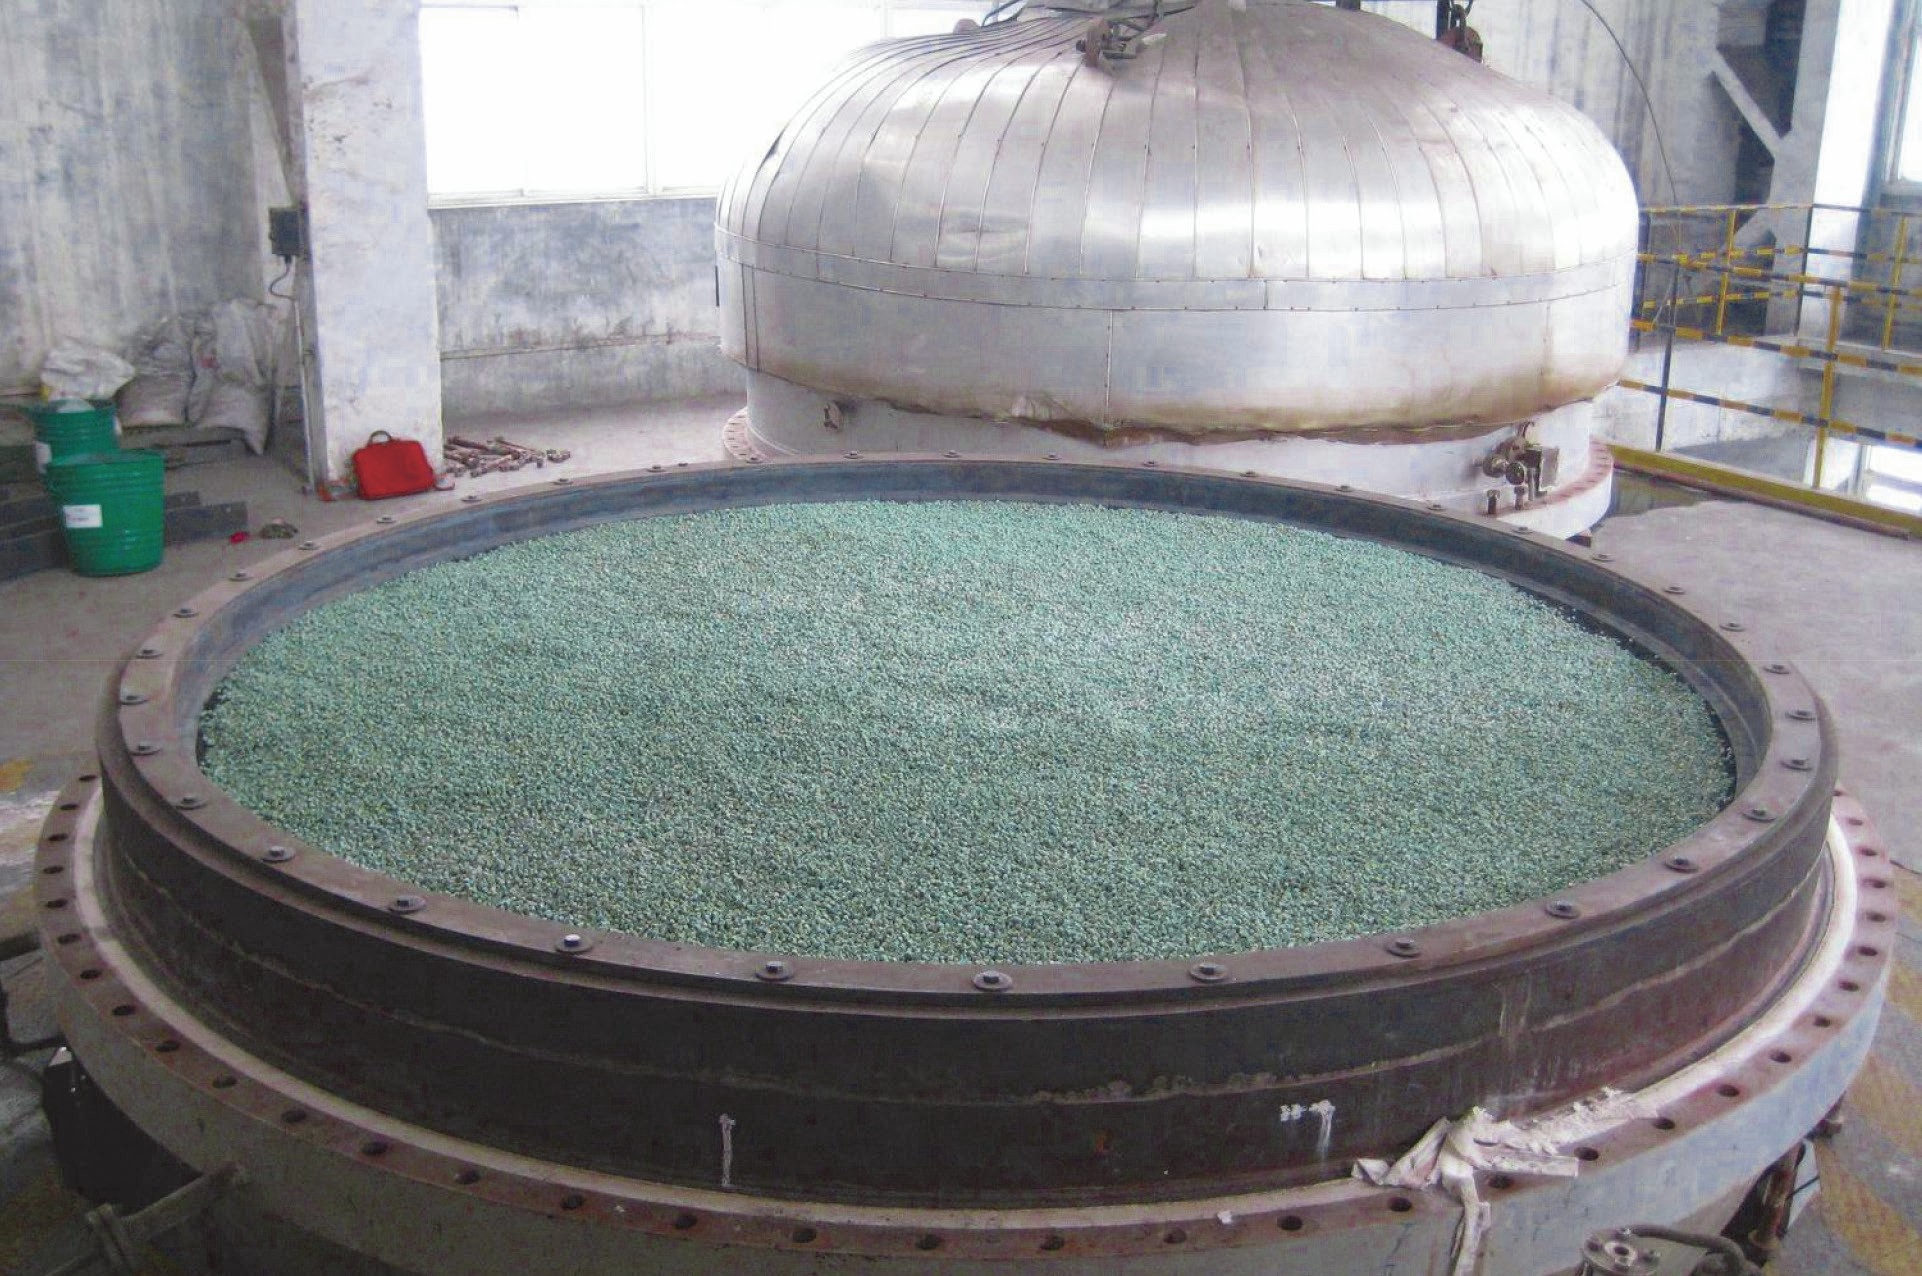
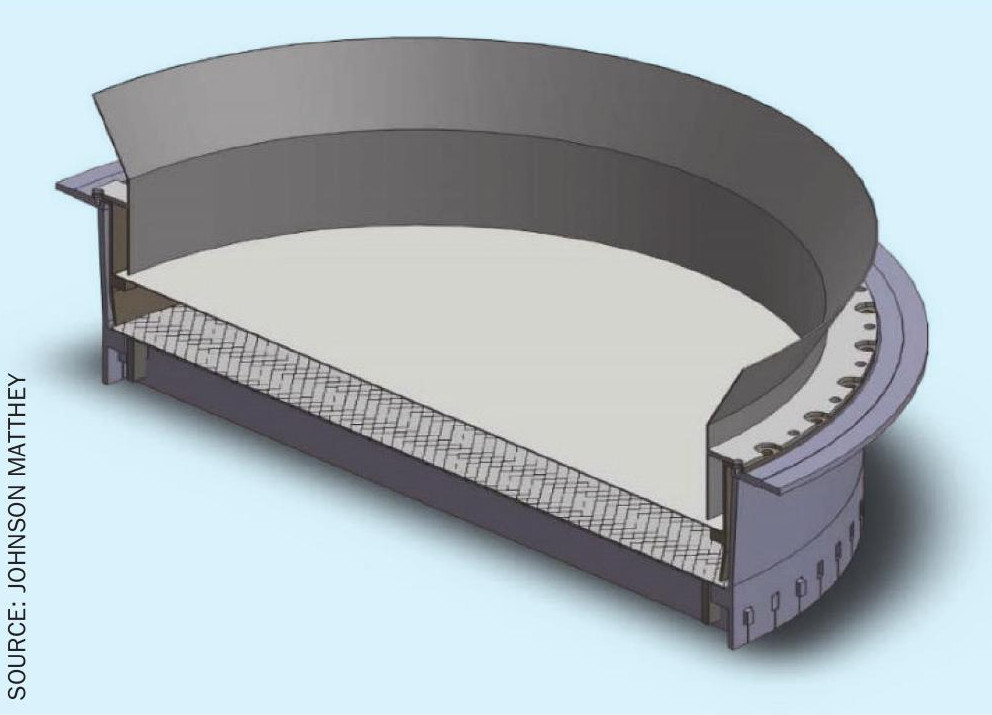
JM provides technical support throughout the whole process, including detailed analysis of the burner support structure, with the catalyst bed needing to be accommodated as a uniform layer across the burner diameter immediately beneath the gauze as shown in Fig. 3.
Abatement basket engineering
JM are experienced in successfully designing robust, stable containment baskets specifically customised for the burner in conjunction with the N2O catalyst. This avoids preferential flow, which improves the performance of the abatement catalyst, and helps to increase the conversion efficiency and to minimise operational costs.
The design achieves the following:
- process gas is evenly distributed through the catalyst bed;
- the required catalyst bed depth is maintained throughout the campaign;
- edge effects are minimised as a source of bypass without interfering with the flow of gas through the gauze pack above.
Thermal expansion coefficients for most of the materials used within a nitric acid burner are around 15 mm per metre, therefore the radius of a 2 m basket would expand by 15 mm. If the catalyst pellets do not move to fill the resulting gap, then this 15 mm gap becomes a route for substantial gas bypass.
As the pressure drop through the pelleted secondary catalyst can be 1.5 to 10 times higher than that of the platinum gauze pack, lower pressure drop around the edge would result in significantly higher gas flow rates, which could be in the region of 3 to 30 times higher than the bulk gas flow rate.
Thermal cycling, which occurs during repeated shutdowns and start-ups of the plant can cause some pellets to move upwards which leads to doming towards the centre of the bed. This increases the pressure drop at the centre and exacerbates the above-mentioned effect.
Containment system
The design of any containment system is dependent on the plant loading, which is defined as the ratio of tonnes per day of nitrogen per square metre cross sectional area.
For high loading plants >30tN/m2 /d extensive modifications are usually required to the existing baskets.
For low and medium loading plants <30tN/m2 /day containment requirements fall into three categories:
- no modifications required;
- moderate modifications;
- extensive modifications.
High loading plants
Specially designed containment is required as in general there is no space for the catalyst to be installed without some form of modification.
Introducing abatement into high loading plants introduces several key considerations when designing a containment system and a degree of compromise is therefore required between abatement performance and the effect on the burner and plant.
One of the most notable issues with high-pressure plants is that the gas velocity is significantly higher than is the case for lower-pressure plants. As a result, more catalyst is required than would be the case on lower-pressure plants. Consequently, there are two interrelated issues, the lack of useable space within the burner and the need for a larger volume of catalyst. Both need to be overcome to optimise abatement.
The optimum volume of catalyst cannot always be installed in a high-pressure plant for two reasons: physical space and pressure drop. In most burners the design of the basket would not facilitate the installation of a secondary catalyst, so space must be created.
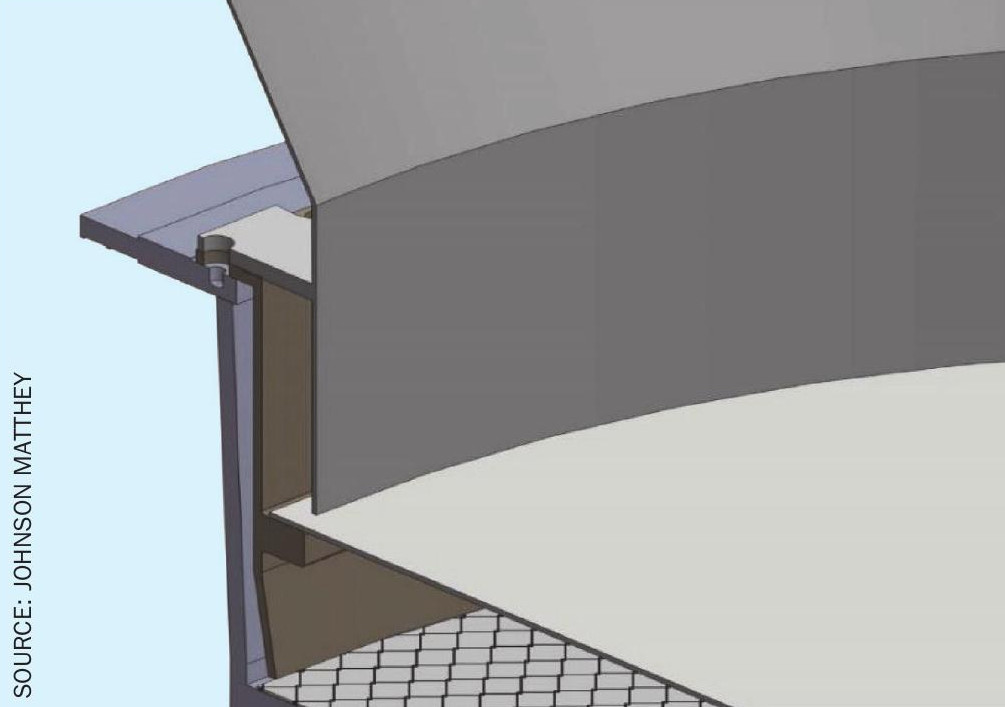
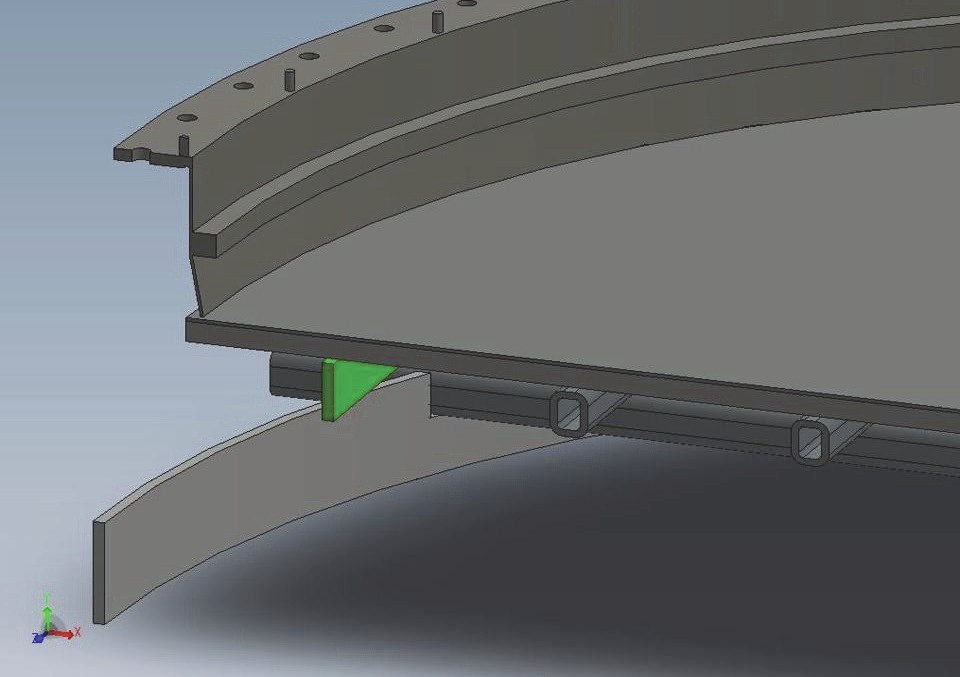
Due to the lack of space in high load plants, it is necessary to engineer space into the burner to create the required room to fit the required amount of catalyst. Typically, gauzes are supported around the middle of ammonia burners, so a common strategy to create additional space in the burner is to move the reaction zone further up the in burner by means of a new containment ring, thus leaving space below (Figs 4 and 5). However, moving the reaction zone can cause the intensity of radiant heat to shift, causing damage to the burner interior and housing. Johnson Matthey has always strived to ensure that exposure of radiant heat to the main basket flange and other internals is limited as much as possible, reducing the risk of damage through thermal deformation. A second strategy is to utilise any space below the basket and above the boiler tubes. If this can be achieved, then the position of the gauzes is maintained and any risk of radiant heat causing damage to the burner interior eliminated.
Low and medium loading plants
To optimise the performance of the abatement catalyst, and to reduce the impact on plant operation and conversion efficiency a bespoke containment system is essential. The options are outlined below.
- Good physical condition: low or no modification is required, a wire mesh screen and skirt is installed to prevent catalyst loss.
- Poor support system: Support system requires redesign and replacing to support catalyst weight.
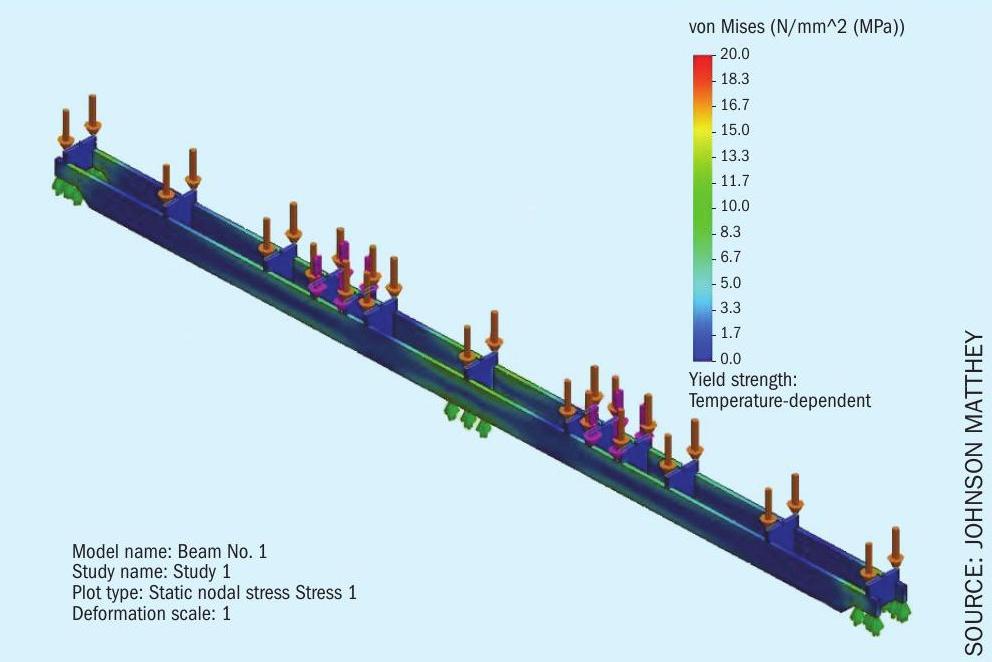
- Basket design: analysis and re-design required of support beam and the installation of containment system required. Beam simulations can be carried out using simulation software.
The containment of the secondary abatement catalyst and the maintenance of bed depth are key to maximising abatement performance.
Option 1: no modification
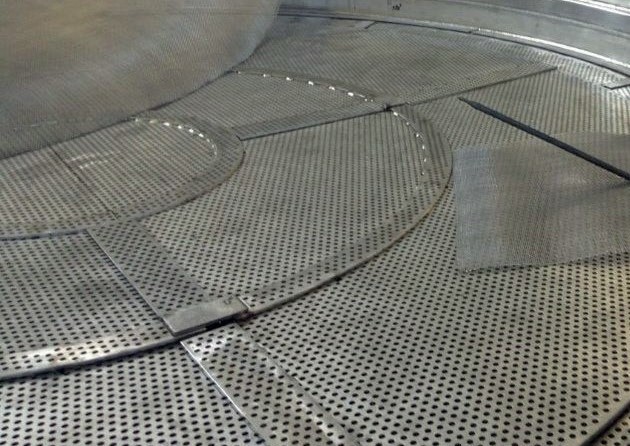
Generally, no modifications are required if the burner basket is in good physical condition, and the bottom support of the basket will allow good flow distribution through the pelleted bed of catalyst. At most, a flat circular mesh screen and skirt or grill would be required to prevent the loss of catalyst pellets. Fig. 6 shows an example of the inside of a basket in good physical condition and with an even and level support. The inclusion of a flat circular mesh screen prevents the loss of catalyst pellets through the 10 mm perforated plates.
Option 2: moderate modification
Moderate modifications would be required if the basket was in poor physical condition or if poor support of the catalyst resulted in an uneven bed depth affecting gas distribution. This may require a new basket and/or replacement of the existing support with a metal honeycomb.
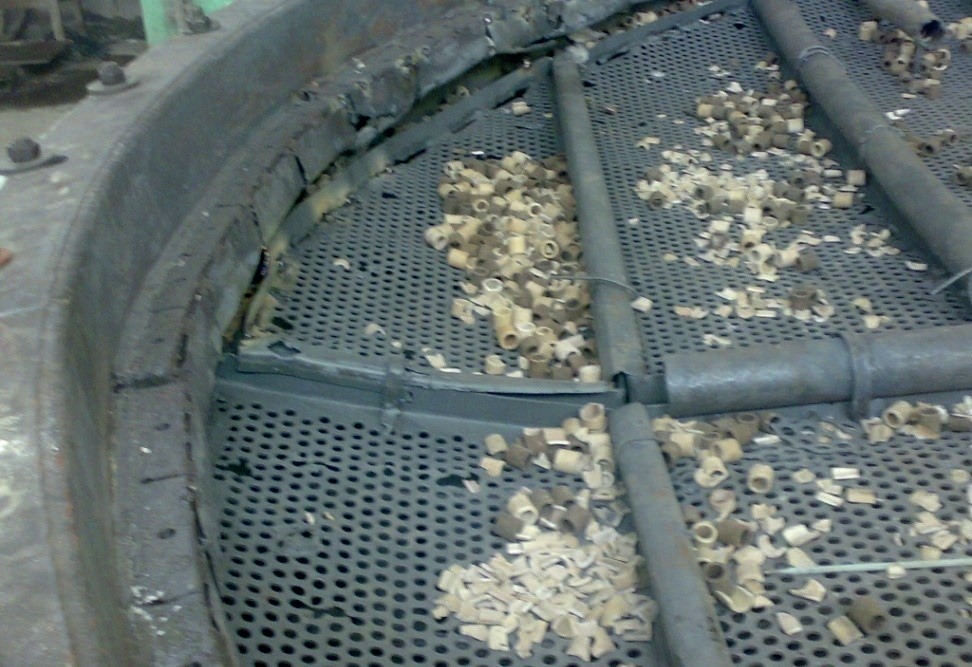
Fig. 7 shows an example of the inside of a basket in poor physical condition and with an uneven support. Not only are the supporting plates dished which would result in differing heights of catalyst being installed, but the design of the C-shaped clamps holding the plates together also presents a problem when trying to install a consistent bed depth of catalyst.
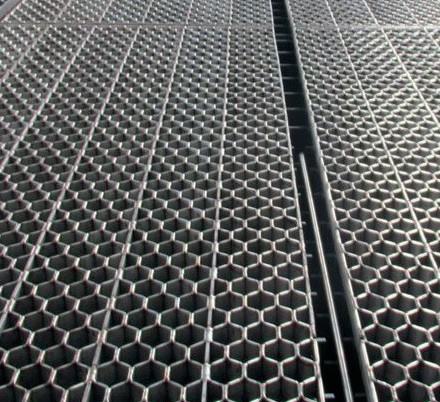
Fig. 8 shows an example of a new basket and honeycomb support. The benefits of a honeycomb support are that the cellular shape resists thermal distortion; it presents a uniformly flat surface onto which secondary abatement catalyst is installed and it can be segmented for easy installation.
Fig. 9 shows an example of a honeycomb support.
Option 3: major modification
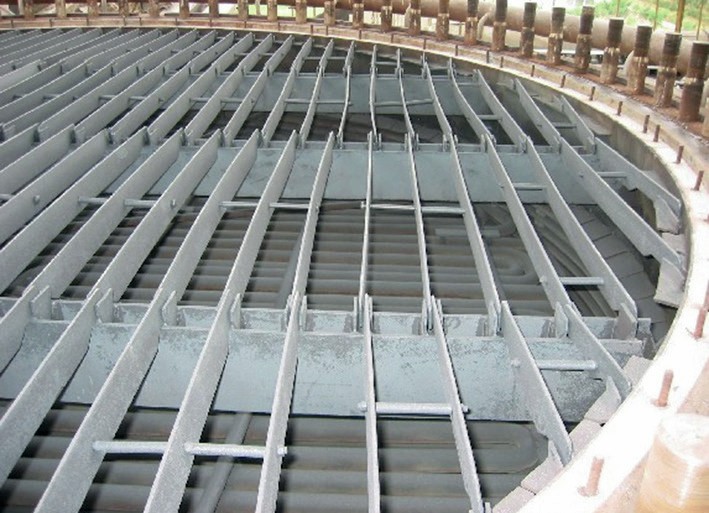
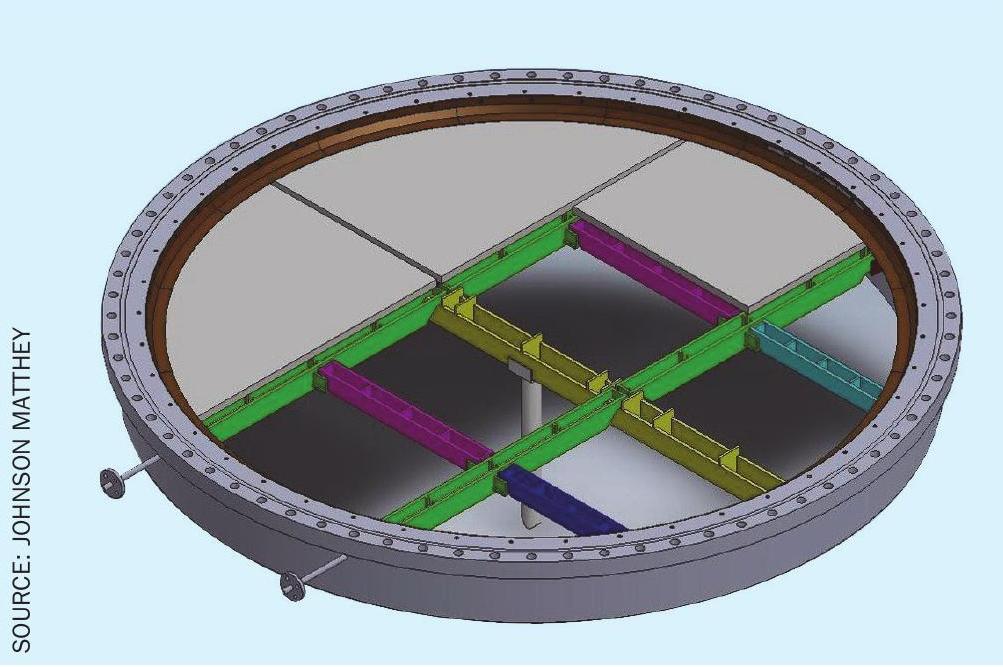
For some plant designs there is no space into which a pelleted catalyst can be installed and instead central support for the gauzes is offered by a series of beams. In such cases the position of the beams needs to be lowered to create space. A means of containing the catalyst is required with the installation of a new containment ring. In addition, the existing beam arrangement would have originally been designed to support the weight and pressure drop from the primary gauzes. As the beams now need to support the additional loads imposed by the pelleted catalyst, the depth of the beams may need to be increased. The material of construction may also need to be changed to a material with improved creep and rupture strength.
Summary
Johnson Matthey’s experience across a wide range of catalyst applications combined with knowledge of process design in this and other sections of the chemical industry, resulted in the development of a number of engineered solutions which allow successful operation of N2O emission reduction catalysts across the diverse range of design of existing nitric acid plants. These modifications vary from minor changes, to prevent loss of N2O abatement catalyst, to a unique and patented design which can be retrofitted easily into plants operating under the most arduous of conditions.
Today this innovative technology is widely used throughout the world and combines leading edge catalysis and engineering designs suitable for retrofit into all nitric acid plants.
References
KBR
KBR sustainable N2O abatement
Since 1954, KBR and its affiliates have licensed over 76 grassroots nitric acid plants globally and is the technology leader in the US market. KBR has experience in successfully revamping plants and fulfilling client requirements across the globe.
Nitrous oxide emissions
Industrial nitrous oxide (N2O) is generated from undesirable side reactions in the production of nitric acid. In 2019, N2O accounted for nearly 7% (457.14 million tonnes) of all US greenhouse gas emissions, resulting from agriculture, fuel combustion, wastewater management, and industrial processes.
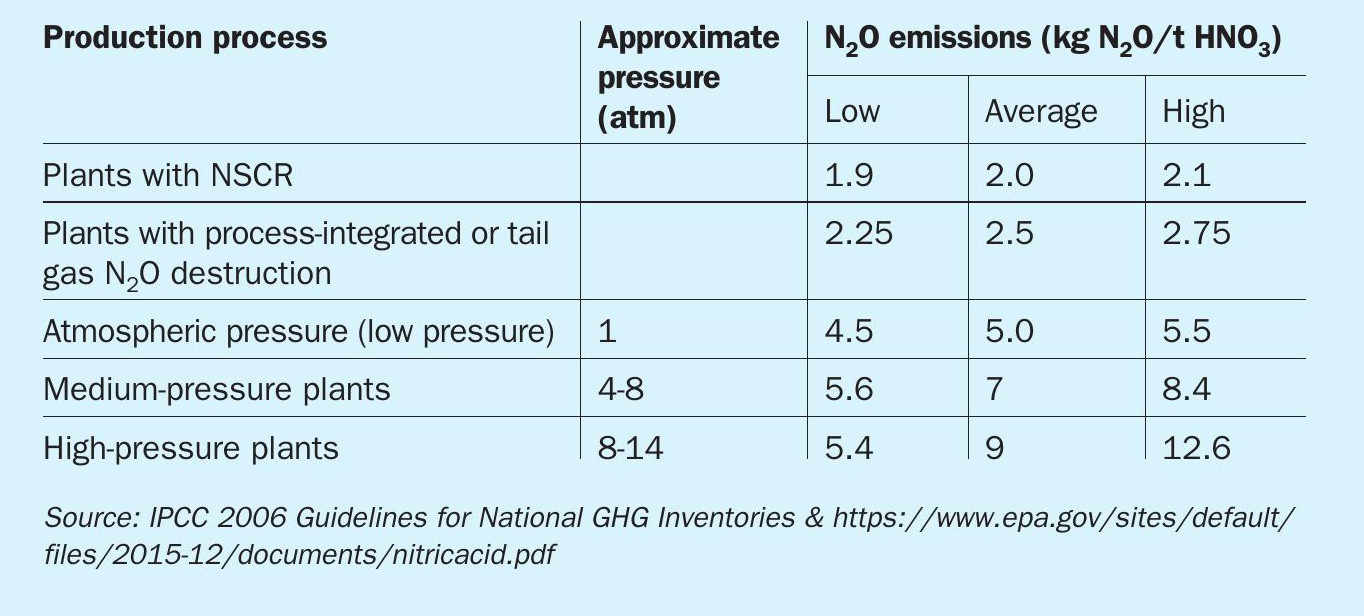
Table 1 shows emissions of N2O per tonne of nitric acid produced.
KBR N2O abatement
Primary abatement
Primary abatement systems conceptually try to reduce N2O generation during NH3 oxidation at the converter. This is basically spontaneous destruction of N2O by high temperature and time. This is a relatively slow destruction process and with longer residence time more N2O can be destroyed. Old KBR-Weatherly nitric acid plants with a horizontal train had more residence time compared to newer plants with a vertical train. This is because in horizontal trains the gas passes through an elbow before entering the heat exchanger. This elbow allows increased residence time leading to primary abatement of N2O.
Since it is not desirable to keep the hot gas at such a high temperature, an exchanger is connected immediately downstream to bring the gas temperature down. This design is followed in current KBR vertical train nitric acid plants. This addresses the maintenance issues faced by the mechanical components exposed to the high temperature.
Abatement of N2O by primary measures are limited and the process has limited efficacy to achieve the acceptable emission norms.
Secondary abatement
Secondary abatement systems work on the principle of installing abatement catalyst after the platinum gauge. This targets N2O reduction from the process stream from the NH3 oxidation stage to HNO3 production stage. The catalyst undergoes several extreme thermal exposures and is susceptible to damage/cracking. The performance of the catalyst has not been very successful at these operating conditions. KBR has not yet guaranteed any removal efficiency with secondary abatement, even though there are KBR plants where they are in operation.
KBR tertiary N2O abatement
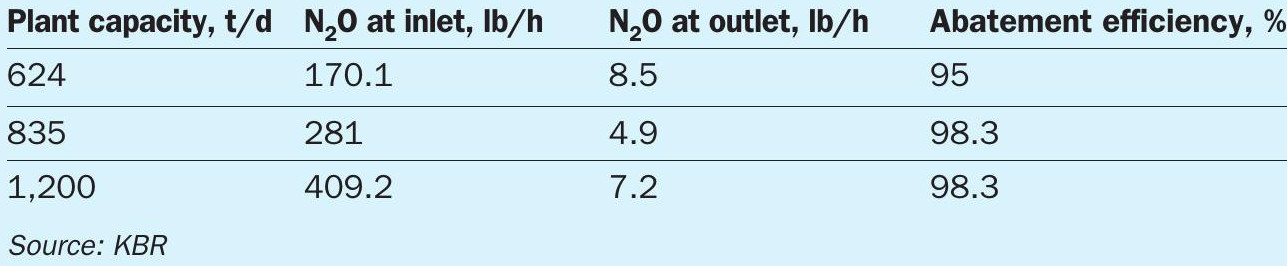
KBR’s N2O abatement process employs tertiary abatement technology and achieves ~95% removal efficiency at an operating temperature range of 350°C to 660°C (Table 2).
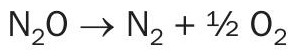
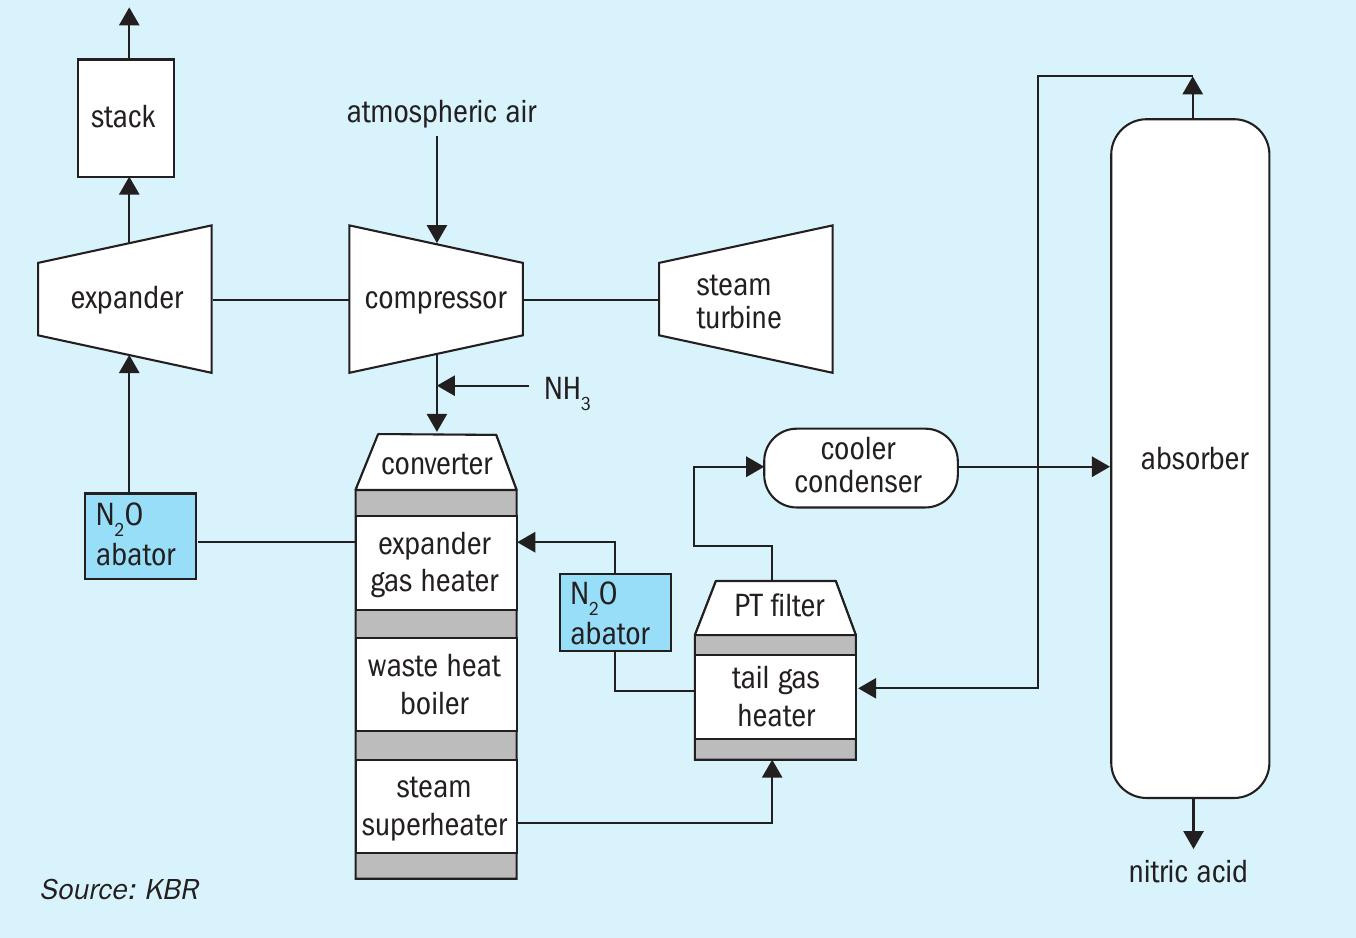
KBR’s tertiary N2 O abatement system employs a catalytic reactor upstream of the tail gas expansion unit. Fig. 1 shows two possible locations of the abator vessel in the KBR nitric acid process. In the tertiary control system, N2O is catalytically decomposed into N2 and O2 :
The process uses a proprietary Fe/zeolite based catalyst, which can be bought in pellet form or as monolith bricks. The tertiary N2O abatement can remove up to 98% of the N2O content in the tail gas stream. The catalyst is housed in a pressure vessel suitable for continuous operation. The catalyst is expected to remain active for a period of five to seven years.
The biggest advantage of the catalyst is that it is highly efficient in N2O abatement up to an operating temperature of 660°C. The nitric acid plants designed by KBR feature the unique expander gas heater that heats the tail gas up to 650°C. The high tail gas temperature improves the power recovery in the expander and maximises the steam export, making the KBR design highly energy efficient. This enables the retrofit of a N2O abatement system between the expander gas heater and the expander.
Alternatively, a unit can be placed upstream of the expander gas heater, thus reducing the operating temperature of the abatement system.
Another significant feature of the design is the low pressure drop in the tertiary N2O abatement system, approximately 20 kPa or less. This is further improved if a radial flow design is used. However, this leads to higher mechanical costs due to the intricate internal basket design inside the vessel.
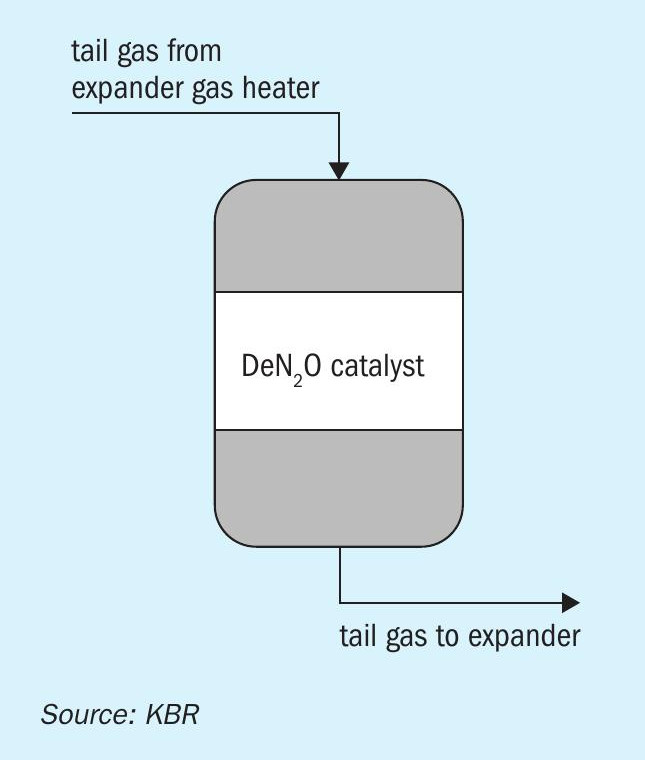
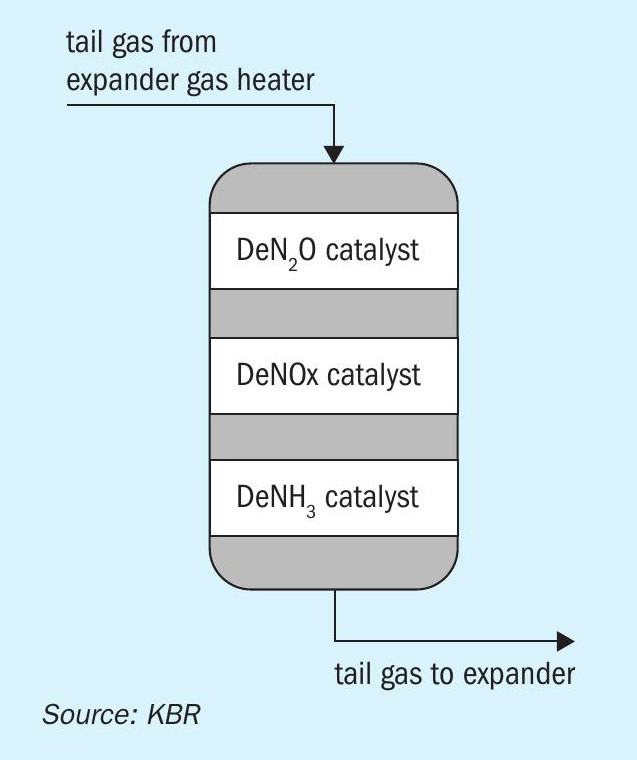
The N2O abatement system (Fig. 2) can be coupled with a NOx abatement system if required. The NOx abatement system can be provided as independent equipment or can be combined in a single reactor with N2O abatement (Fig. 3).
Equipment design
The N2O abator vessel is designed as a hot-wall down-flow reactor. The tail gas enters the vessel from the top and is uniformly distributed over the monolith bed. Computational fluid dynamic analysis helped KBR to design the proprietary inlet distributor, which ensures smooth distribution of the tail gas above the catalyst bed. This helps in maintaining a uniform operating pressure profile across the reactor bed. Uniform distribution of tail gas helps achieve a linear temperature gradient during startup and shutdown, thus reducing the thermal loads on mechanical components.
The catalyst bed is supported by the support beam and grid. A 24-inch manway is provided above the catalyst bed to allow for easy installation of the monolith bricks and the support grid.
The equipment is made of special stainless steel with stringent chemistry restrictions. This enables a longer life suitable for the harsh operating conditions including temperature and pressure cycles. Being in cyclic service, the equipment is subjected to fatigue stresses. This is carefully addressed by the mechanical design with compliance to all ASME requirements. The support skirt is designed with a hot box to address the thermal cycles. The inlet and outlet nozzle design addresses the temperature and pressure cycles for a minimum life of 25 years.
The benefit of the proven hot wall design is the reduction in weight compared to a cold-wall refractory-lined design. KBR can provide a cold wall design if requested by the client. This will however lead to higher capital cost due to higher weight and the more complex design.
While a radial flow design provides better pressure drop control across the bed, the simpler axial down-flow design leads to a reduction in weight by 40%. The axial flow design enables use of monolith brick design catalyst, which can be easily installed during turnarounds. The simpler design of the reactor internals offsets the slightly higher cost of a monolith catalyst compared to pelletised extrudate catalyst. This translates to a lower capital cost for the client for installing a new N2O abatement unit.
Also based on client requirements, the equipment can be sized or rated for a higher capacity in the future. This additional margin can be used later with additional catalyst as and when to meet future requirements.
Summary
With multiple units operating successfully and meeting N2O emission restrictions, KBR’s tertiary N2O abatement system is helping nitric acid producers worldwide to meet governmental environment regulations as well as providing a sustainability commitment to society in general. The technology license is further enhanced by proprietary equipment supply by KBR which meets the best design, fabrication, and quality control industry standards. Thus, KBR is able to support clients with an end-to-end solution from design to delivery. By operating at a higher temperature range up to 660°C, the increased energy efficiency at the expander is an added advantage for the KBR process. KBR’s proprietary reactor is designed to withstand the severe operating conditions and have a design life of up to 25 years. With relatively easy installation, the KBR process is suitable for both grassroots projects and brownfield retrofits.