Nitrogen+Syngas 379 Sept-Oct 2022
30 September 2022
The nitric acid market
NITRIC ACID
The nitric acid market
Most nitric acid is used for production of fertilizer nitrates and ammonium nitrate explosives, but it is also used in polyamides, polyurethanes and aniline dyes as well as a number of industrial processes including ore treatment. High ammonia prices have pushed nitric acid prices to record levels this year, but growth predictions remain robust.

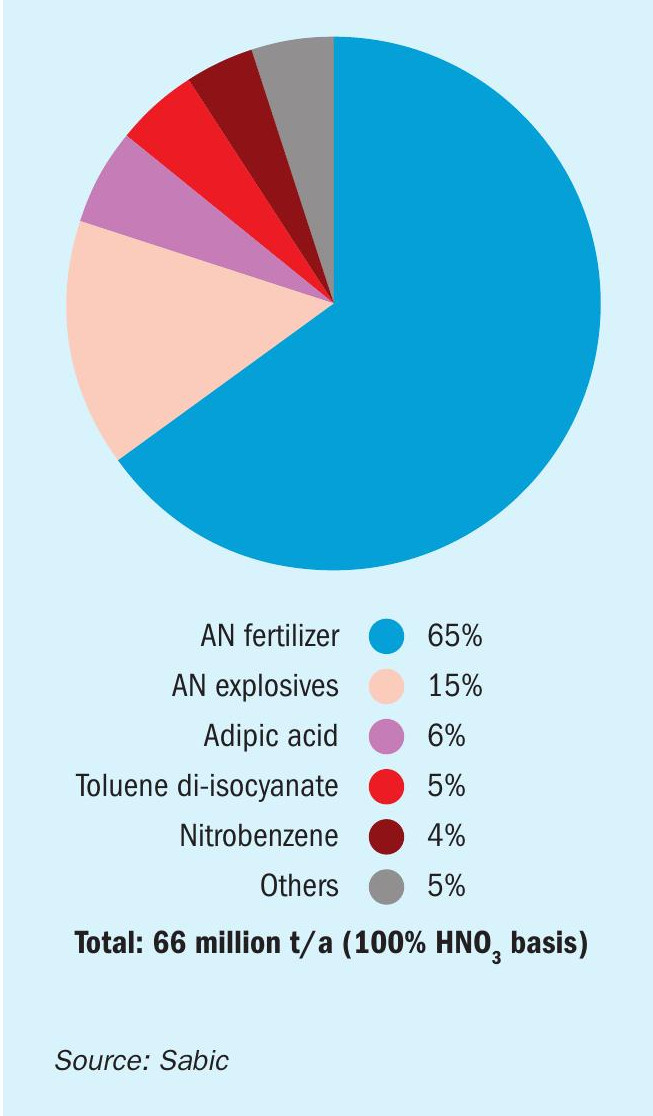
Nitric acid is the second most used industrial acid after sulphuric acid. Based on 100% nitric acid, total tonnage produced was about 66 million t/a in 2020. The route almost exclusively used for nitric acid production is the Ostwald process; the oxidation of ammonia over a precious metal catalyst, and nitric acid production represents about 18% of all ammonia demand globally.
In terms of end uses, nitric acid is predominantly used for the production of ammonium nitrate and its various derivatives, including urea ammonium nitrate (UAN) and calcium ammonium nitrate (CAN), as well as other specialty fertilizers and mixtures such as NPK fertilizers (Figure 1). Outside of its fertilizer use, AN is also widely used in the explosives industry as a component of ammonium nitrate-fuel oil (ANFO), a mixture that is the most common industrial blasting explosive, used in mining and quarrying, and representing around 90% of the commercial explosives market. However, while around 80% of nitric acid is used in AN manufacture, the remainder goes to a number of industrial processes, most notably nitrobenzene production, for use in dyestuffs, toluene diisocyanate (TDI), used in polyurethane manufacture, and adipic acid, used in polyamide manufacture. There is also a substantial quantity used in metal extraction and treatment, especially ferrous metal etching and cleaning, as well as the reprocessing of uranium. Highly pure (>98%) nitric acid is used in the semiconductor industry.
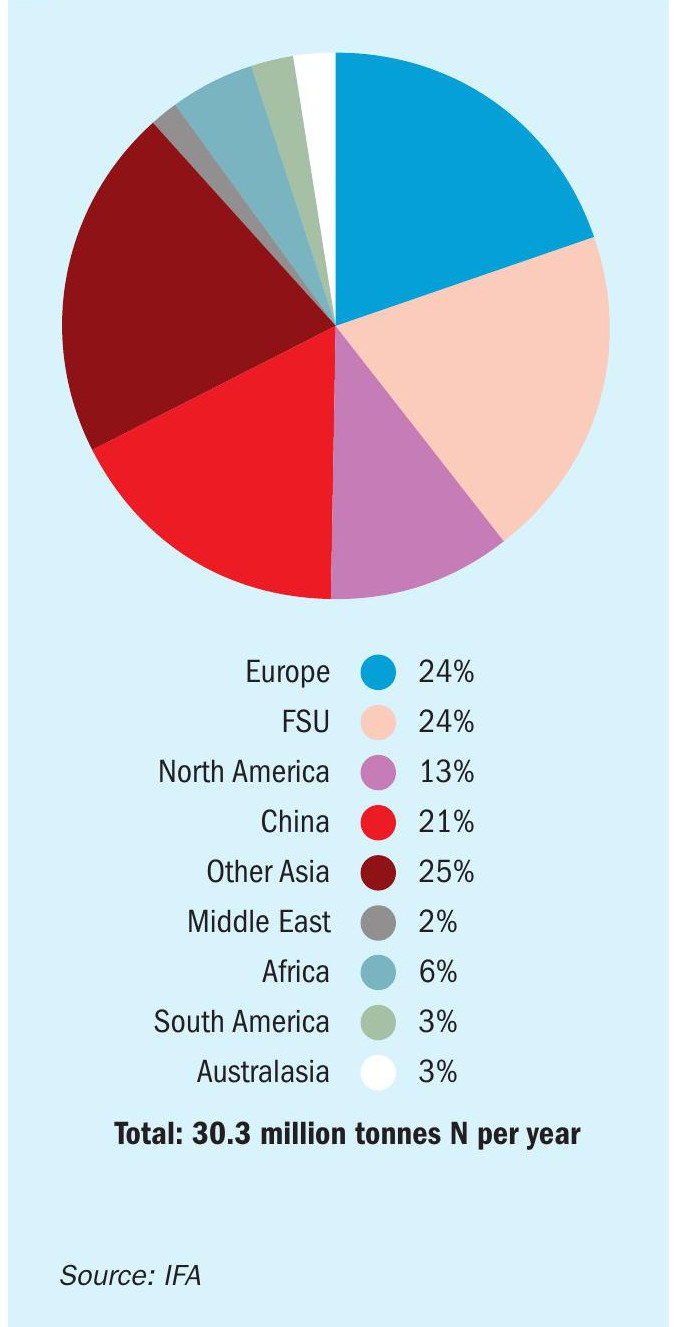
Geographically, nitric acid capacity is concentrated where AN is manufactured, primarily in Europe and Eurasia and North America, but capacity is also growing rapidly in China. As Figure 2 shows, these regions between them represent over 80% of all AN capacity. However, while nitric acid consumption in Europe, Eurasia and North America is focused primarily on production of ammonium nitrate and UAN/CAN, Chinese nitric acid consumption is conversely heavily biased towards chemical uses, which account for around 70% of demand. Metallurgical and pharmaceutical uses add another 20% to this, with ammonium nitrate for explosives and fertilizer use still very much a minority of consumption. China’s nitric acid production is mainly (ca 50%) concentrated in the east of the country, particularly Jiangsu, Anhui, Zhejiang and Shandong provinces.
Demand
The coronavirus pandemic had a major effect on many end-use industries, from fertilizers to chemicals manufacture, with lockdowns causing disruption to production, supply and consumption. The effect was particularly pronounced on the car industry, leading to reduced demand for plastics and polyamides. This led to the first fall in nitric acid consumption for several years in 2020, though the figure for 2021 rebounded to approximately the 2019 level. Prior to this, however, demand had been growing steadily, if unspectacularly.
In terms of end-use markets, ammonium nitrate fertilizer use rose by 18% over the preceding decade to reach 17.3 million tonnes N in 2020. Europe was the largest consuming region, at 3.0 million tonnes N for the EU, with Russia and the US close behind at 2.9 and 2.8 million tonnes N respectively. However, consumption in China is rising rapidly, almost doubling over the decade to reach 2.2 million tN/a. Ammonium nitrate is preferred as a fertilizer in regions with short growing seasons, as the nitrate is present in a form readily available to the plant, unlike urea, which must hydrolyse to nitrate in the soil before it can be taken up. This has helped AN keep its share of nitrogen fertilizer consumption in spite of concerns over its safe storage and handling, as evidenced by the explosion in Beirut harbour in 2020, or any potential for misuse as an explosive by dissident groups. However, the markets in which it finds use are fairly mature in terms of fertilizer use and consumption, and so outside of its increasing use in China, growth in demand for AN fertilizer is relatively slow, with overall consumption increasing by about 1.6% per year.
The commercial explosives market, meanwhile, is based mainly based around mining and quarrying, with some used in road and other construction. Three industries have traditionally dominated demand for mining explosives; coal mining, iron ore mining, and copper mining, collectively using more than two thirds of all explosives. Of these three, coal mining has remained essentially static over the past decade, with production rising only 1% from 2011 to 2021, when it reached 167 million t/a according to BP figures. Production is concentrated in China (50%) with India, Indonesia and the US representing another 25%. Iron ore mining is an even larger industry, and production was 2.6 billion t/a of ore in 2021 (1.6 billion tonnes Fe), with Australia, Brazil, China and India the leading producers, representing around 80% of production between them. Production has risen about 8% over the past decade. Finally copper mining stood at 21.0 million t/a in 2021, with Chile by far the largest producer, followed by Peru, China and Congo. Copper is the fastest growing of the three sectors, with production having risen by over 30% from 2011 to 2021. Overall, demand for industrial grade AN has risen at about 1.4% per year over the past decade.
Industrial chemical markets are a much faster growing segment, with average annual growth rates for TDI, nitrobenzene and adipic acid ranging from 3.5% to 4.9%, and it is a similar story for some of the metal treatment segments. However, collectively they only represent 20% of nitric demand, and so growth in these segments only brings the overall growth rate for nitric acid demand to just over 2% year on year. China remains the fastest growing single market.
Nitrous oxide
The nitric acid industry has come under increasing pressure to reduce its emissions of nitrous oxide, N2O. It is estimated that around 5 kg of nitrous oxide are produced for every tonne of nitric acid, which has turned nitric acid production into the single largest industrial process source of nitrous oxide. Because of N2 O’s high global warming potential; around 270-300 times that of CO2 , even the emission of relatively lower quantities can have a significant impact on man-made climate change. The US, for example, calculated that 7% of its CO2 -equivalent emissions came from nitrous oxide in 2020, mainly from emissions form soil during the breakdown of nitrogen fertilizers.
Because of this, installation of N2O abatement technologies has been strongly encouraged via the Kyoto Protocol, and has become mandatory in some jurisdictions: for example, since 2013 it has been obligatory for nitric acid plants in the European Union to have such abatement technology installed. Three ways of controlling N2 O emissions are recognised; primary, secondary and tertiary. Primary reduction comes during the ammonia oxidation process itself, using lower reaction temperatures, or perhaps via modification of the precious metal catalyst gauze such as substitution of cobalt, though this also makes the reaction less selective. Secondary abatement happens prior to the process stream reaching the absorption tower, and tertiary is an ’end of pipe’ solution that selectively reduces N2 O. End of pipe solutions are often preferred, as many nitric acid plants are of considerable vintage (over 30 years old) and may not be as amenable to changes to the process section. Iron zeolite catalysts have proven effective at decomposing N2 O to N2 and O2 , and form the basis of thyssenkrupp’s EnviNOx® process, which has achieved N2 O removal rates of 98-99%, with overall NOx emissions being reduced to as low as 1 ppmv. BASF’s rival DeNOx process uses a vanadium oxide catalyst instead for similar effect. Last year, Clariant donated 10 loads of its EnviCat catalytic reduction catalyst to nitric acid producers who did not have existing abatement systems.
However, of the estimated 580 nitric acid plants operating globally, around half are believed to still have no N2O abatement technology in place, mostly in countries without the appropriate emissions control legislation in place. To try and combat this, the German Environment Ministry’s Nitric Acid Climate Action Group (NACAG) has been partnering with governments and nitric acid producers in these countries and providing financial support to install abatement technology. Signatories to its Declaration now include Tunisia, Argentina, Mexico, Zimbabwe, Indonesia, Vietnam, Cuba, Pakistan, Thailand, Jordan, Georgia, Uzbekistan, Colombia and Bosnia, and most recently it has assisted with a tender for abatement technology for Sable Chemicals in Zimbabwe, and a study on abatement options for the government of Thailand.
The merchant market for AN
As nitric acid is a difficult and dangerous chemical to store and transport, about 90% of it is produced for captive use on-site, integrated into downstream AN and other production. The merchant market for nitric acid is comparatively small, with China the largest importer, but production growth is gradually switching towards Asia as countries like India and particularly China try to boost domestic production for industrial uses. Chinese production is often at the higher end of the cost curve and can act as a swing producer of acid. However, the covid pandemic and associated shutdowns of chemical producers which consume nitric acid in China has impacted upon domestic demand, which has kept a lid on prices.
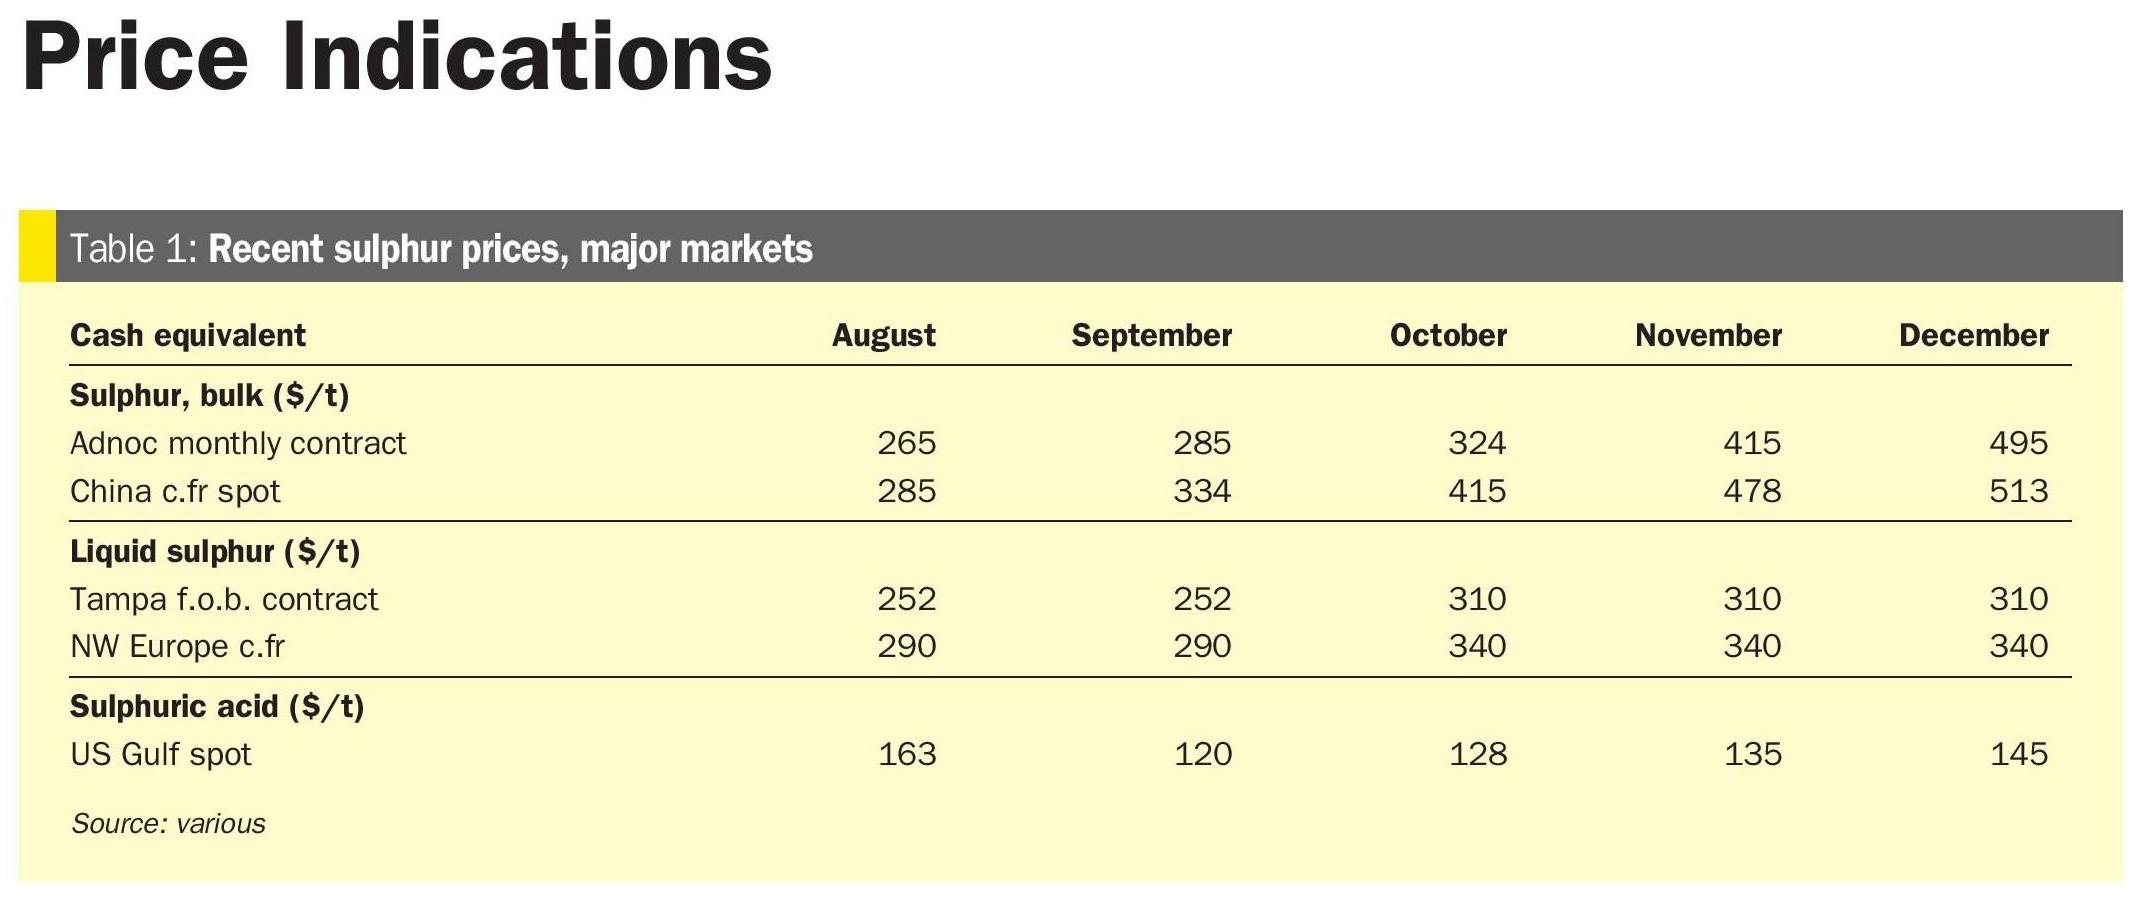
Nevertheless, as with virtually all commodities, the war in Ukraine and subsequent sanctions on Russia has impacted upon the nitric acid market. Rising fuel and freight charges, and particularly the surge in the price of ammonia led to nitric acid prices reaching $420/t in Europe in March 2022, $380/t in the US and $450/t in China. Since then, however, prices have peaked and weaker market fundamentals have reasserted themselves.