Nitrogen+Syngas 386 Nov-Dec 2023

30 November 2023
The merchant ammonia market
AMMONIA
The merchant ammonia market
Merchant markets for ammonia have faced considerable disruption in recent years due to the covid pandemic and the war in Ukraine.

Global production of ammonia has risen fairly continuously over the past few decades, though with occasional pauses and plateaus due to major geopolitical events, such as the dip following the breakup of the Soviet Union in the early 1990s. During the 2010s world ammonia production rose from 159 million t/a in 2010 to 186 million t/a in 2020, but again in recent years there has been a dip in production and consumption; the disruption caused by first the covid pandemic and then the cessation of shipments from Ukraine due to the war there saw production drop to 184 million t/a in 2021 and 182 million t/a in 2022. Most of the fall in production in 20202022 has come in Europe and the Russian Federation. However, figures for the first six months of 2023 show a rebound; there has been a rise in production of 4% year on year compared to the same period in 2022, which would translate to a full year figure of 189 million t/a if maintained for the rest of the year.
Because it is toxic and must be transported as a liquid cooled to below -33C, most ammonia is instead consumed at the point of production for downstream conversion into urea, nitric acid, ammonium nitrate and other chemicals. The merchant market for ammonia is therefore much smaller than the overall market, and in 2022 stood at 18.1 million t/a, or only about 10% of total production, of which 16.6 million t/a – or over 90% of the merchant market – was moved by ship or barge, and the rest by rail tanker. However, merchant ammonia is particularly important for some consuming segments, such as production of industrial chemicals such as caprolactam (for fibre production), acrylonitrile, adipic acid, and isocyanates (for polyurethane production), where production is often close to centres of demand. Due to the difficulty of transporting explosives over long distances, merchant ammonia is also often used for low density (explosive grade) ammonium nitrate production. And because ammonia has historically been produced where feedstock is cheaper, in major gas producing regions, and because these do not often coincide with sources of phosphate rock, merchant ammonia is also widely used in ammonium phosphate fertilizer manufacture, as ammonia is much lighter to transport than phosphate rock. A small amount of merchant ammonia is also imported by urea and ammonium nitrate producers in regions with relatively high domestic gas costs which makes local ammonia production less economic, such as India and southern Africa.

Merchant ammonia production, conversely, tends to be in low gas cost regions with easy access to ports and overseas shipping. On a regional basis, as shown in Table 1, it can be seen that the major net importing regions continue to be North America (mainly to feed DAP production in Florida, Western Europe (for a variety of uses, often industrial/technical), South Asia (mostly to feed Indian DAP and some urea production) and East Asia (Japan, South Korea, Thailand and Taiwan are all net importers, again often for industrial/technical uses). By nation, the largest importers are the United States (2.6 million t/a in 2021), India (2.3 million t/a), Morocco (1.7 million t/a), South Korea (1.4 million t/a) and Turkey (1.0 million t/a). On the export side, the major volumes come from Russia (4.4 million t/a in 2021) and Trinidad (3.9 million t/a). The Arabian Gulf states (including Iran) add another 2.7 million t/a to that, and North African countries (mainly Algeria and Egypt) another 2.1 million t/a.
Changing patterns of supply and demand
On the demand side, the largest importers continue to be the United States and India. In spite of India building several large ammonia-urea complexes to attempt to reduce the country’s dependence on imported urea, there is very little surplus ammonia capacity from these plants, and the impact on ammonia imports for Indian DAP production has been small. Conversely, US imports of ammonia have generally been on a declining trend as lower cost shale gas production leads to more domestic capacity being built or restarted. In 2012, at the peak of its import demand, the US imported 7.8 million t/a of ammonia from overseas. By 2020 this had fallen to below 2.4 million t/a, and although 2021 saw a slight rebound to 2.6 million t/a, this dropped back to 2.3 million t/a in 2022 and is expected to be lower still for 2023.
Morocco
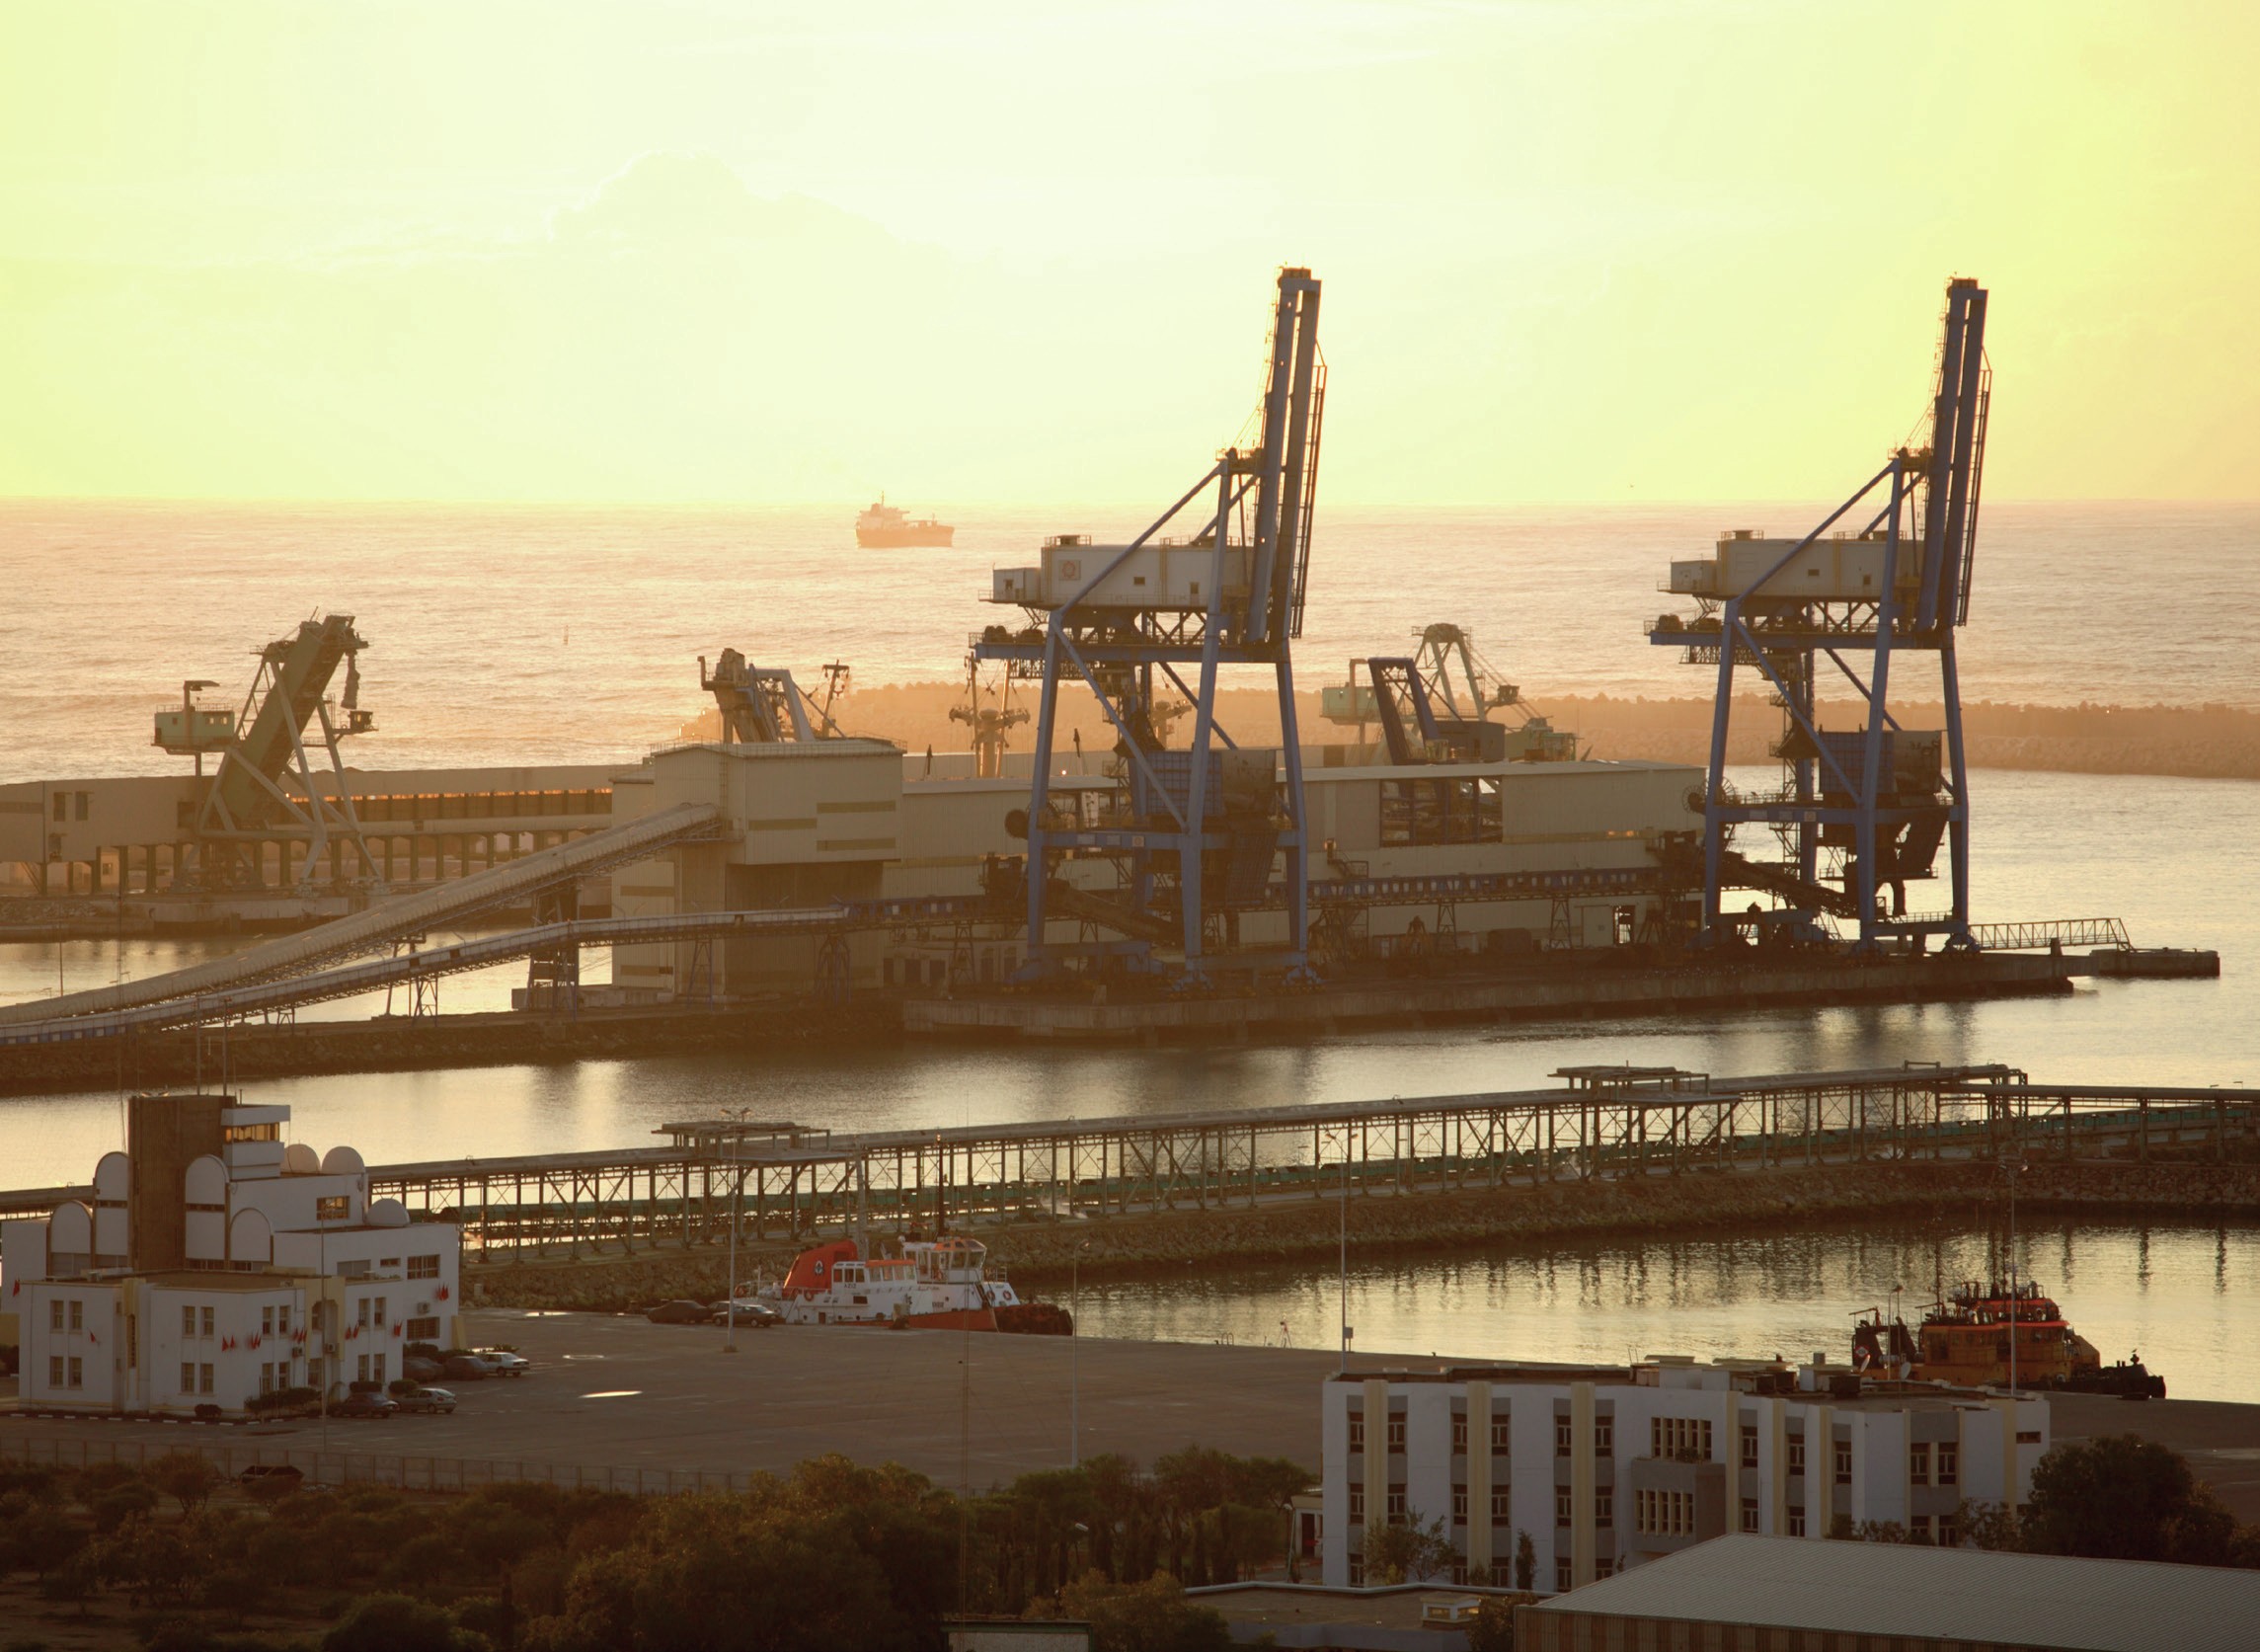
Morocco’s imports of ammonia are increasing as state phosphate company OCP continues to build new mono- and di-ammonium phosphate (MAP/DAP) capacity to capture more of the phosphate value chain. Morocco’s ammonia imports have gone from 0.5 million t/a in 2010 to 2.2 million ta in 2022; more than four times higher in just 12 years, and the country may soon overtake the US to become the world’s second largest ammonia importer. More phosphate capacity is under development, and as Morocco has no gas of its own, this will likely mean more ammonia imports. However, OCP has been looking very seriously at developing ‘green’ electrolysis based ammonia capacity domestically, using the desert country’s abundant sunlight, and in the much longer term this may come to play a factor in Morocco’s need for imports.
Europe
Europe’s imports of ammonia increased in 2021-22 because of the impact of the war in Ukraine, and a steady reduction in gas flows from Russia. Gas prices skyrocketed in the winter of 2021 leading to widespread shutdown of European ammonia capacity. European ammonia production dropped by over 5 million t/a from 2020-2022. However, imports rose only by a few hundred thousand tonnes to 5.2 million t/a over the same period, as high ammonia prices in Europe led to demand destruction in downstream industries. At the peak of the shutdowns, 70% of European ammonia and urea capacity was shut down, and 50% of nitrate capacity. Production has reopened during 2023, but is still down on its pre-war/pandemic value.
Exports – Russia and Ukraine
While patterns of imports have changed significantly, undoubtedly the largest impact of the war in Ukraine has been on ammonia exports, particularly from Russia and Ukraine. Prior to the war, Russia had been ramping up its export-oriented ammonia capacity, including the start-up of an 890,000 t/a plant for Eurochem at Kingisepp in northwest Russia. Cheap gas and rising domestic demand for fertilizer had been leading to something of a boom for Russian nitrogen production. However, the war closed the ammonia export pipeline across Ukraine to Odessa, and effectively ended all Black Sea exports of ammonia. While urea was rerouted to the Baltic Sea, Russian ammonia exports dropped from 4.4 million t/a in 2021 to 0.8 million t/a in 2022. Exports for 2023 are expected to be up, but a resumption to ammonia exports which had been one of the Russian government’s conditions for allowing Ukrainian grain exports to continue, did not eventually materialise. In the meantime, Russia has approved the construction and operation of an export terminal in Taman, to be owned and operated by TogliattiAzot. The first phase, which is due to be operational by the end of 2023, will have a capacity of 2 million t/a, and a second phase with 3.5 million t/a of capacity is due for completion in 2025.

Meanwhile, Ukraine was likewise also once a major exporter of ammonia, but much of its domestic capacity had already been shut down by the conflict in the Donbas region in east of the country from 2016, while high gas prices closed most of the remainder of the country’s production. The export-oriented Odessa Port Plant (OPZ) was operating only intermittently because of unpaid gas debts, and has closed down since the conflict began.
Middle East
The Middle East has only around 11% of global ammonia capacity, but much of that is export oriented, and in 2022 it exported 4.2 million t/a of ammonia, a 50% increase on the 2.8 million t/a exported in 2021. Most of that production (2.6 million t/a or 62%) came from Saudi Arabia, which has added new capacity at Ma’aden III. Qatar exported 0.5 million t/a, and Iran just under 0.6 million t/a. As capacity in Russia and Ukraine has become constrained, so Middle Eastern countries have increased production and managed to gain a greater share of the global merchant ammonia market. In 2022 Saudi Arabia became the second largest ammonia exporter in the world after Trinidad.
Trinidad
In the 1980s and 90s, Trinidad developed an ammonia economy based on supplying the merchant market with cheap ammonia using natural gas feedstock from its offshore gas fields. But government controls on gas prices disincentivised gas producers from exploring and developing new production, and so as the gas fields have matured and production has begun to fall, so Trinidad has faced problems with maintaining ammonia production. Thus although it remains the second largest exporter of ammonia in the world, Trinidad has seen its ammonia exports fall due to gas supply constraints, from 5.3 million t/a in 2010 to 3.6 million t/a in 2022. At the same time, its main market, the continental United States, has been importing less and less ammonia, and so Trinidadian producers have had to look further afield for customers. Europe’s gas difficulties in 2022 were an unexpected bonus for Trinidad as it provided a ready market for what ammonia Trinidad was able to produce. Until more gas fields can be opened up, Trinidadian production is likely to remain constrained, and new production will have a much higher cost base for its gas feedstock.
New merchant capacity
There have been a number of additions to merchant ammonia capacity in the past 18 months, including Ma’aden III, commissioned in March 2022, which added 1.1 million t/a of capacity over and above that required for DAP production. Not far away, Salalah Methanol in Oman started up an ammonia plant in September 2022 with an additional 330,000 t/a of capacity. But the largest concentration of new capacity seems to be occurring in the US Gulf Coast, where there are several projects competing to develop ‘blue’ ammonia capacity using carbon capture and storage for enhanced oil recovery in the oil fields of the region, boosted by US government subsidies under the Inflation Reduction Act. OCI has already begun construction of a 1.1 million t/a plant at Beaumont, Texas which is due to be completed in 2025. CF Industries has also committed $285 million to enable existing plants in Louisiana and Mississippi to capture and sequester carbon and together with Mitsui is considering construction of a new blue ammonia plant in Louisiana. Yara, in partnership with Enbridge, is also approaching a final investment decision on a $2.9 billion blue ammonia plant in Texas with a capacity of around 1.3 million t/a. Both of these projects could be onstream in 202728, and Yara is also partnering BASF on a second blue ammonia project with a tentative date of 2028-29. Finally, Nutrien is evaluating a site at Geismar, Louisiana, where it already has a facility, to produce 1.2 t/a of blue ammonia with a provisional onstream date of 2027.
Many of these developments are predicated on tightening environmental regulations, such as Europe’s upcoming Carbon Border Adjustment Mechanism, as discussed in our other articles in this issue. There are hopes in some quarters that low carbon ammonia may achieve a degree of take-up as a marine fuel, though at the moment these projects are still at a developmental stage, or as a power plant fuel in Japan, which is looking to import several million t/a of blue ammonia to lower its carbon emissions at existing power plants.
A year of oversupply
A glance at the graphs in the markets pages of this issue will show just how volatile ammonia prices have been over the past three years. By far the largest disruptions have come from gas shortages and high ammonia prices in Europe leading to shutdowns of both ammonia and downstream capacity, and the closure of the Black Sea to ammonia exports. US and Middle East exports have risen as a result, while India is importing more. A factor in supply of ammonia is the relative price differential between ammonia and urea prices. When ammonia prices are significantly above those for urea, producers who are capable of doing so are encouraged to shut down the urea section of their plant and sell ammonia instead. But the run of high ammonia prices that incentivised ammonia production is over now, and prices have fallen back to relatively low levels. Indeed, thanks to the demand destruction in Europe and the startup of new capacity the ammonia market has spent much of 2023 oversupplied, Only towards the end of the year have prices seen an uptick as some demand begins to return.
But European gas prices could still be a major factor in the ammonia market this winter. Europe has made a remarkable turnaround in the way it sources gas after having the pipelines from Russia turned off, with new LNG import capacity supplementing existing imports and an increasing switch to renewables. There has been a conscious attempt to fill storage during summer, as there was last year, and at the start of November 2023, going into winter, gas storage levels were reported to be 99% across the continent. But Europe is still likely to consume more gas than it can import over winter, and while last year was a relatively mild one, prolonged cold weather could see gas prices rise rapidly and a return of ammonia shutdowns. There are also continuing worries about the conflict in Gaza, with the potential for it to spread and affect the wider region. The ammonia market continues to be extremely volatile, and 2024 is looking difficult to predict.


